Euro Pacific Bank

December 2017 New Products & Platform Updates

GTS MobileTrader Enhancements

Over the coming months, improvements in design and functionlity will be coming to the mobile platform.

Navigation Improvements

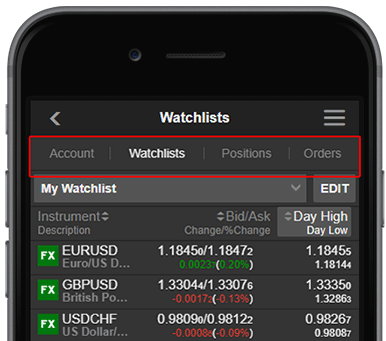
Improvements to the navigation offering quick navigation between the most used sections of the platform:

  • Watchlist
  • Positions
  • Order
  • Account

Search Enhancements

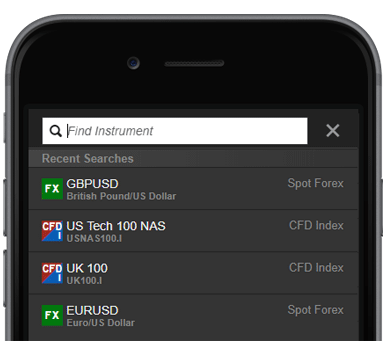
Search will deliver recently viewed instruments alongside a search input field for quick and easy access.
Market Data Changes (Reminder)

A number of exchanges will increase real-time data fees from 1 January, 2018.

Stock Exchanges: Private Professional
  Level Currency Current Price New Price Current Price New Price
Euronext Stock Exchange Level 1 EUR 1.00 1.25 63.00 68.00
Level 2 EUR 1.00 1.50 91.00 95.00
Euronext Stock Indices Level 1 EUR 1.00 1.25    
Futures Exchanges: Private Professional
Euronext Commodities Derivatives Level 2 EUR 12.00 15.00 12.00 15.00
Euronext Equity & Index Derivatives Level 1 EUR 1.00 1.25    
Level 2 EUR 32.00 34.00 32.00 34.00
OPRA Data Level 1 USD     30.50 31.50

New Account Section Coming to GTS

The New Account Section recently introduced in the GTS-web platform will also be enabled in the desktop application. For more details, see here.

November 2017 New Products & Platform Updates

Product Updates

New Ethereum tracker ETN now available

After getting exposure to Bitcoin, clients can now also get access to trade the Ethereum ETNs listed on Nasdaq OMX Stock Exchange. As previously announced, two Bitcoin Tracker ETNs listed on the same exchange are also offered.

Please note, a subscrition to the Nasdaq OMX Stock Exchange to acqire access to the ETNs.

Please note there is inherent risk involved in trading ETNs, including credit, liquidity, and market risks involved in trading these products.

Product Enhancements

New Chart Annotation Tool – Linear Regression Lines

Linear Regression Lines is a new statistical chart annotation tool which tries to predict future values from past values and is a straight line that best fits the prices between a starting price point and an ending price point.

A “best fit” means that a line is constructed where there is the least amount of space between the price points and the actual Linear Regression Line.

Traders use the Linear Regression Lines to try to determine a trend direction regarded as the fair value. If the price for an instrument is below a Linear Regression Line for some time, it could be an indication of a trend change and this could be considered a buy signal. Similarly, if the price is above the Linear Regression Line it could be considered a sell signal.

It can be difficult to identify how far below or above the line a price should move from the Linear Regression Line before it is a good buy or sell signal. For more objective indicators, extra lines can be added parallel to the Linear Regression Channel – we have added extra lines by default at ±1 and ±2 Standard Deviations. You can remove these outer lines in the configuration settings for the annotation.

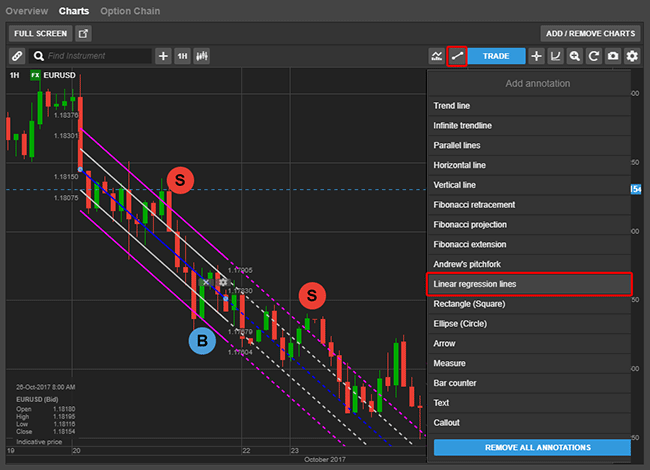
The following EURUSD chart shows a Linear Regression Channel with the lines extended (shown as dashed lines).

We have indicated a few areas on the chart where it might be a good signal to buy or sell i.e. when the price crosses the outer 2 Standard Deviations line from the Linear Regression.

In the configuration settings for each Linear Regression Line you can delete or add lines, extend them as well as the usual configuration such as colors, line type and calculation details.

Improved user experience to remove all annotations and studies on an instrument

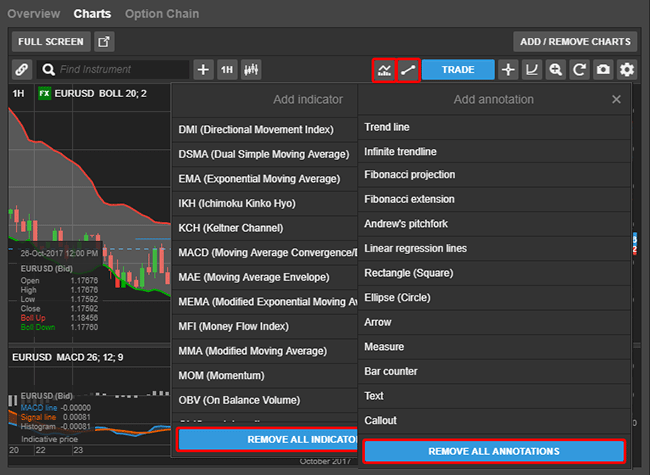
Existing annotations and studies on an instrument can now be removed all at once, making it easier for traders to start a new analysis on the same instrument.

A new Remove all Indicators button will be available from 4 November 2017 in the Indicator drop down menu which will remove all annotations and studies on the current instrument.

Similarly, a Remove all studies is available in the Studies menu to remove all studies on the instrument (both overlay and sub-panels studies are removed).

Upgrade to GTS Pro mandatory from 1 December 2017 – Reminder

The recent upgrade to GTS Pro becomes mandatory from 1 December 2017. Because the upgrade cannot be installed on Windows XP and Windows Vista, it will no longer be possible to use the platform on these operating systems by 1 December.

Operational Changes

Market Data Changes

General market data subscription fees changes as of 1 January 2018

The following exchanges and data providers will change their subscription fees for market data access from 1 January 2018.

Stock Exchanges: Private Professional
  Level Currency Current Price New Price Current Price New Price
Euronext Stock Exchange Level 1 EUR 1.00 1.25 63.00 68.00
Level 2 EUR 1.00 1.50 91.00 95.00
Euronext Stock Indices Level 1 EUR 1.00 1.25    
Futures Exchanges: Private Professional
Euronext Commodities Derivatives Level 2 EUR 12.00 15.00 12.00 15.00
Euronext Equity & Index Derivatives Level 1 EUR 1.00 1.25    
Level 2 EUR 32.00 34.00 32.00 34.00
OPRA Data Level 1 USD     30.50 31.50

October New Products and Platform Updates

Improvements to “Transactions not booked”

“Transactions not booked” in Account Details has been expanded to include provisional amounts that are calculated daily, but booked monthly. Provisional amounts now include:

  • CFD finance
  • Futures and listed option carrying costs
  • Option holding fees

CFD finance and interest calculations details are available in detailed reports.

We made these improvements in an ongoing effort to improve the user experience and accuracy of account value details.

.NET Version 4.62 required in GTS Pro

An upgrade to GTS Pro Desktop Application will soon be released which requires the .NET Framework 4.62

New Account Section Coming to GTS

As communicated previously, a New Account Section is getting rolled out to GTS in November. To stay up-to-date with the newest info, see here.

More updates to follow