Euro Pacific Bank

April 2019 New Products & Platform Updates

Product Updates & Enhancements

New product overview in GTS and GTS Pro

In April, we will be launching a major upgrade to the Product Overview pages in GTS and these pages will be made available in GTS Pro.

The overview pages will continue to offer an in-depth overview of the instrument selected in the watchlist, positions list, order list or through the global search function in the platform.
Summary

The Summary tab will continue to offer market overview for the instrument and can include:

    -market depth (for exchange traded instruments)
    -a simple range chart showing price movements for a selected period
    -Trade Signals (from Autochartist)
    -news

More sections with more information are planned in the near future.

Combination orders for Exchange Traded Options in GTS and GTS Pro

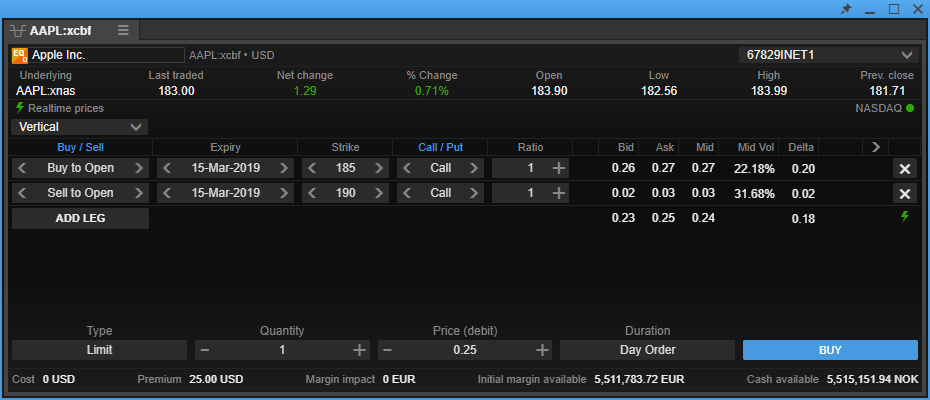
In April, we will launch an Option Strategies trade ticket in the GTS desktop and GTS PRO platforms offering multi-leg exchange-traded option trades.

The new Option Strategies module:

    -offers a choice of common option strategies
    -supports custom strategies with up to 4 legs
    -will be launched from the option chain
    -will initially support US listed options
    -supports configurable columns for Greeks and market data

New Net FX Exposures module in GTS Pro – from April

In April, we will be launching a new FX Exposures module in TraderPRO which will give a detailed breakdown of your net FX exposures by currency.
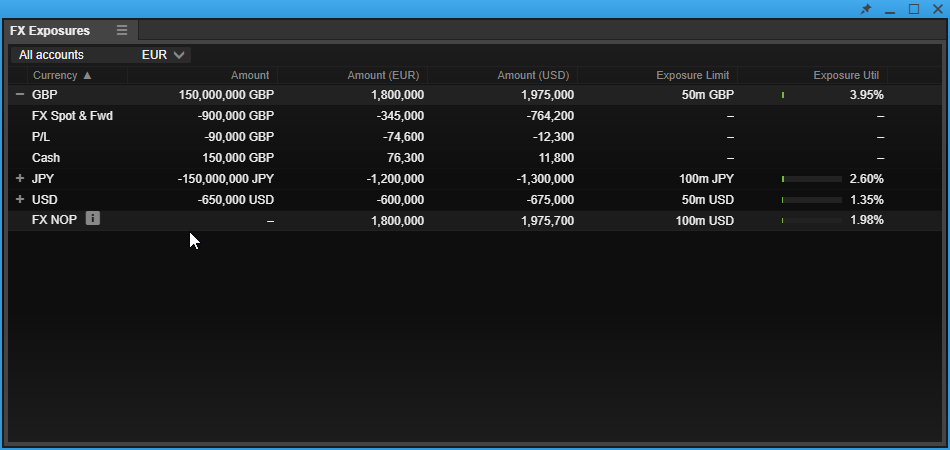
The FX Exposures module will be available from the TraderPRO Menu as a module that you can dock in your workspace.

FX Exposures shows a breakdown of net position by currency for a selected account or group of accounts.

The columns show your net FX exposures:

    -by currency
    -in your account currency a
    -in USD

Customizable columns offer sorting by currency, exposure in account currency or exposure in USD. Exposures can be itemized by trade, P/L and cash components of the exposure.

The FX Exposure module also displays your exposure limit for each exposure currency the % utilization, and your total FX Net Open Position (NOP) exposure limits.

Advanced search – available from April

From April, an enhancement to the search will be available allowing you to refine searches by for example product, currency, country and sector and will allow you to sort results by product, popularity or alphabetically.
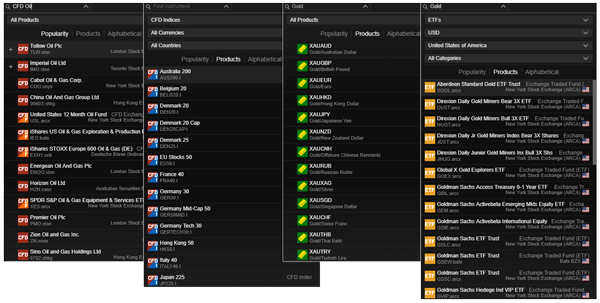
The down arrow on search fields will give access to the Advanced search options which allow you to filter results by:

    -Product (FX, FX Options, CFD indices, CFD Stocks etc.)
    -Currency (USD, EUR, GBP, etc.)
    -FX category (Majors, Minors, Exotics)
    -Country (for exchange listed products, Mutual Funds and Bonds)
    -Sector (for stocks, futures and CFDs)
    -Type (bonds, mutual funds, ETFs)

Results can further be sorted by:

    -Popularity (default option)
    -Product
    -Alphabetically

New chart feature

2- and 3-minute chart intervals are now available on charts in the TraderGO and TraderPRO platforms.

These can be added to the Period selector in charts by clicking the Customize link in the selector.

Operational Changes

Equity Research services discontinued

As previously announced, Equity Research will be discontinued in April 2019 and the Equity Research and Stock Screeners will be removed from all platforms.

Please contact [email protected] if you have further questions about these changes.

February 2019 New Products & Platform Updates

Product Updates & Enhancements

FX trailing stop order handling

From 19 December 2018 we have implemented a small but significant change to the way that we handle FX trailing stop orders.

    -Trailing stop if offered orders to sell will now follow the bid price (previously they followed the offer). They will continue to be triggered on the offer price.
    -Trailing stop if bid orders to buy, will now follow the offer price (previously they followed the bid). They will continue to be triggered on the bid price.

Previously, where a trailing stop if offered order to sell followed the offer price, spread widening would result in the stop order being dragged higher by a temporary spike. When the spread returned to normal levels, the stop order would then be triggered resulting in unexpected trailing stop behaviour.

We have therefore made this small change to protect clients from unexpected order fills as result of spread widening around market volatility or market opening e.g. Sunday open.

New chart features

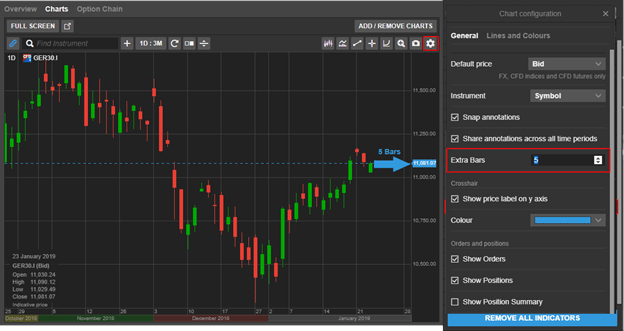
Extra bars

Extra Bars is a useful new feature that allows you to create space between last updated bar or candle and the y-axis, adding space for projecting annotations into the future.

You can add space from chart configuration menu available from the right-click menu (desktop) or the chat settings icon.

Annotation persistence across chart windows

Chart annotations are now remembered for each instrument and will be available whenever you open a new chart for the instrument.

If you have several instances of a chart open for the same instrument, the most recent changes to the chart annotations will be used.

Time range persistence when zooming

If you zoom or pan in the chart, the chart now persists the time range if you close and reopen the platform, detach the chart or select another instrument. If I pan the chart to show a time range of 2016 – 2017 for example, opening a new instrument in the chart will show the time range 2016 – 2017.

Click on the Reset icon to quickly reset to the time range selected.

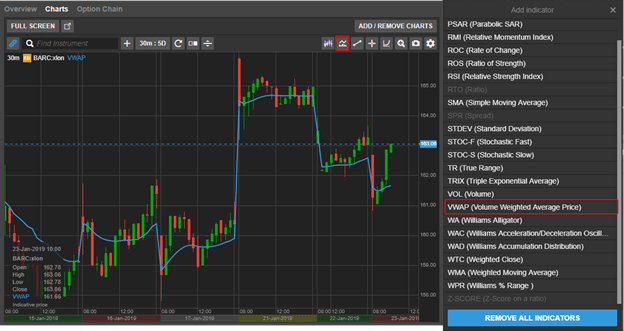
Improved Volume Weighted Average Price (VWAP) indicator (9th February)

The calculation behind the Volume Weighted Average Price (VWAP) indicator will be improved to more accurately display the average weighted price by volume – the value of all trades in a trading session divided by trading volume.

VWAP is similar to a moving average with a lagging indicator used on intraday time periods only. Contrary to the moving average, VWAP accumulates volume throughout the trading session.

VWAP can be used to compare the current price to the VWAP value to determine the general direction for the instrument – if current price is below the VWAP line prices are falling, if above prices are rising.

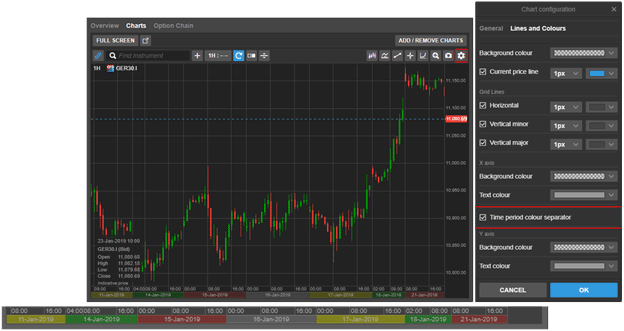
X-axis time period colour separator (9th February)

To improve the readability you will be able to add colours to the x-axis to make it easier to quickly identify different trading periods.

Go add colours to the time period under Chart Configuration > Lines and Colours the check the Time period colour separator checkbox

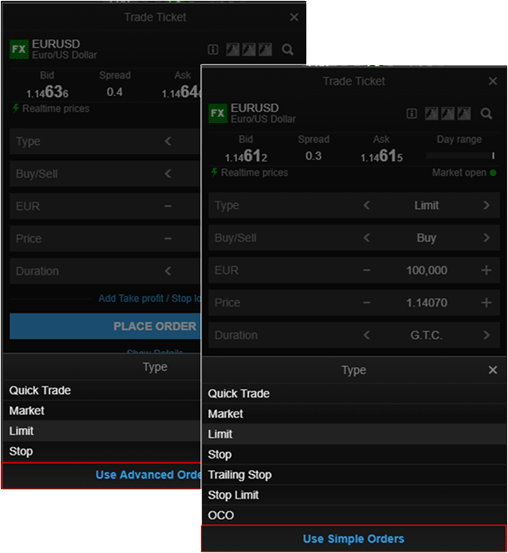
Simple order types in GTS Web


From February, an option will be available in the Trade Ticket when placing orders, allowing you to simplify the order types, hiding complex order types and limiting the list to Market, Limit and Stop orders used by most clients.


Design updates

A number of design updates to GTS Mobile will be released in the coming months. In close contact with clients, we have been making a number of usability improvements to the mobile trader. Most notably we will increase the font sizes and certain navigation buttons and icons to improve legibility and navigation.

Font sizes will also be increased on GTS Mobile on the desktop.

A number of enhancements will soon be released in the GTS Pro platform allowing traders to more efficiently navigate the platform using the keyboard.

FX stop order simplification

From February 2019, FX stop orders will be simplified where Stop if Bid and Stop if Offered will be labelled Stop orders throughout the platform in trade confirmations and order and position lists. Similarly, Trailing stop if Bid and Trailing Stop if Offered orders will be labelled Trailing Stop orders.

These orders will continue to be placed and triggered in the same way.

Operational Changes

Mandatory event notifications and corporate actions on Bonds

To provide better service clients, we are happy to announce that from 4th February 2019:

Notifications on mandatory corporate events

Corporate Action Notifications will be provided on mandatory events for Stocks, Bonds and Mutual Funds.

Clients can access this information under Account > Other > Corporate Action Mandatory Events. Events will be shown until their Ex date/effective date + 30 days.

Equity Research services discontinued

Equity Research available through the platforms will be discontinued in April 2019.

We are working on a replacement for this service which will be available before the Equity Research is retired.

Spot metal XPDUSD to be discontinued

Due to a deterioration in the underlying liquidity available in XPDUSD, we are no longer able to support trading in Palladium/USD.

From Monday 21 January 2019 clients are no longer be able to open new positions in XPDUSD and by Friday 15 February 2019 all existing positions must be closed. After this date, we will close all open positions and cancel any open orders on your behalf.

Please note that should you wish to gain exposure to Palladium, we continue to offer trading of Palladium CFDs and Palladium (PA) Futures.

Please contact [email protected] if you have further questions about these changes.
October 2018 New Products & Platform Updates

GTS desktop and tablet ticket upgrades

During the month of October, we will be updating the trade and order tickets available in GTS for desktop and tablet, aligning the platforms with the current ticket offerings in GTS Mobile and GTS Pro.

Keyboard controls for GTS and GTS Pro

We now have keyboard controls in grids which have been focused on (i.e. active window in GTS Pro or part of the workspace that has been clicked on with the mouse).

  • Cursor up and down will move up and down items in selected grid
  • Page up and down will work as expected
  • Same for HOME and END keys
  • ENTER will trigger primary action in same manner as mouse double click and launch:
    • Trade Ticket from Watchlist
    • Modify order ticket from Orders blotter
    • Close position dialogue from Positions grid
    • Trade Ticket from Closed positions grid

September 2018 New Products & Platform Updates

Initial margin now available in trade ticket

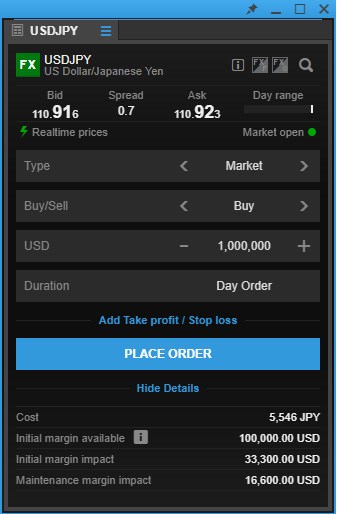
For those regions where margin instruments have an initial and maintenance margin configured, initial margin available is now shown in trade tickets in all platforms in addition to the initial and maintenance margin impact. Initial margin available shows the funds available for opening new margin positions.

New trade ticket in GTS

A new trade ticket will be available in GTS from 20 September 2018 — already available in GTS Pro, and GTS Mobile.

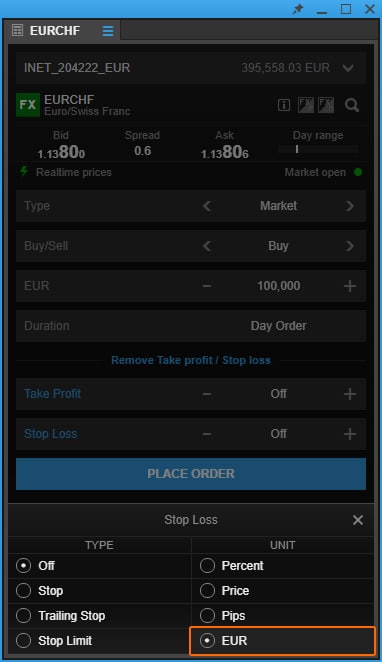
Take profit / stop loss in account currency

Take Profit / Stop Loss in the Account currency in addition to a price, distance in % or distance in Ticks / PIPs.

Keyboard support

GTS Pro now offers basic keyboard support in the trade ticket to improve the efficiency and speed of entering trades and orders.

Keyboard support now includes:

  • TAB to move to the next input fields
  • SHFT + TAB will go to back a field
  • UP/DOWN to increase/decrease the values of a field, e.g. a price or amount
  • ENTER to complete current field
  • ENTER (or SPACE) to activate a selected link
  • CTRL + ENTER takes you to the Place Order button for quick execution 

Other features recently added to the new trade ticket

Second currency FX spot trading

Trading using the second currency is now available in GTS and GTS Mobile allowing you to trade in amounts in the second currency.

Persistence of input fields

GTS Pro now saves input values for each instrument when a trade or order has been placed, persisting them the next time the instrument is selected. This includes all order fields including stop loss and take profit order settings (not the order price field).

Market depth in trade ticket

For clients subscribing to level 2 data for an exchange, the market depth is now also shown in the trade ticket for reference.

New position and order indicators in charts

We have recently released a number of improvements to the position and order indicators in the charts.

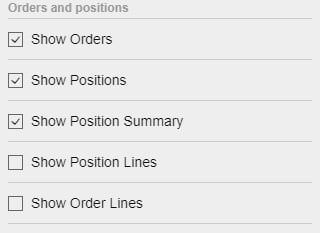
Positions, orders and order/position price lines can be shown or hidden in the chart settings

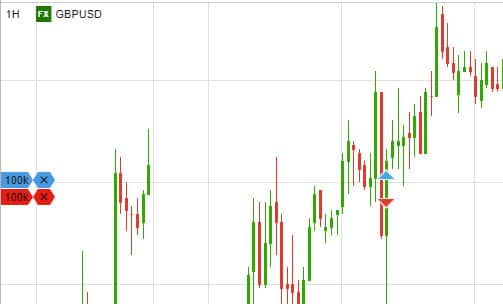
Position indicators

Open positions are shown as:

  • A triangle on the chart at the price and time the position was opened
  • An indicator on the left side of the chart showing the size of position

These are coloured blue for long position red for short positions.

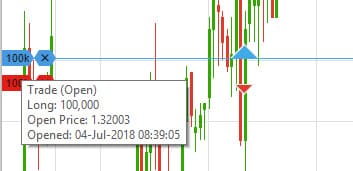
Hovering over the indicator on the left:

  • The triangle is highlighted 
  • A horizontal line appears to better show the price at which the position was opened
  • A tool tip with detailed info about the position is shown

You can close the position by clicking on the X. That opens a prepopulated trade ticket.

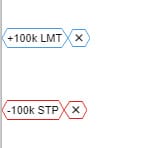
  • The order indicators are outlines and are coloured blue for buy orders and red for short orders 
  • Hovering over the indicator shows a tool tip with the order details and a horizontal line showing the price 
  • The indicator also shows the order type LMT(Limit) or STP (Stop) 

To edit an order
Click on the amount. 

To cancel the order
Click on the X.

July 2018 New Products & Platform Updates

Product Updates & Enhancements

GTS Mobile improvements

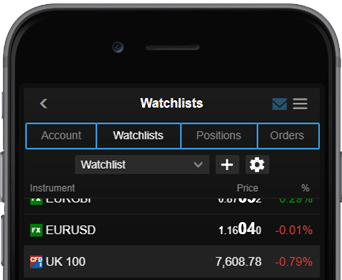
New navigation

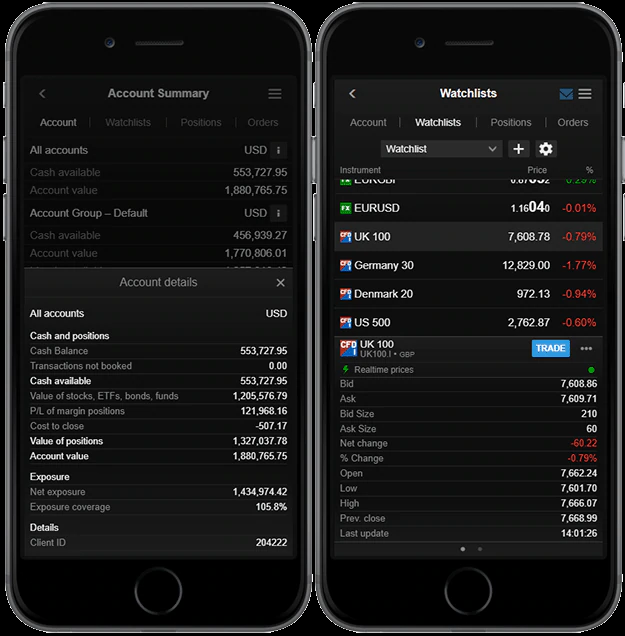
The new navigation makes it fast and easy to access the main components: Account Summary Watchlists, Positions and Orders in a single tap.

Other functions are accessed through the menu icon.

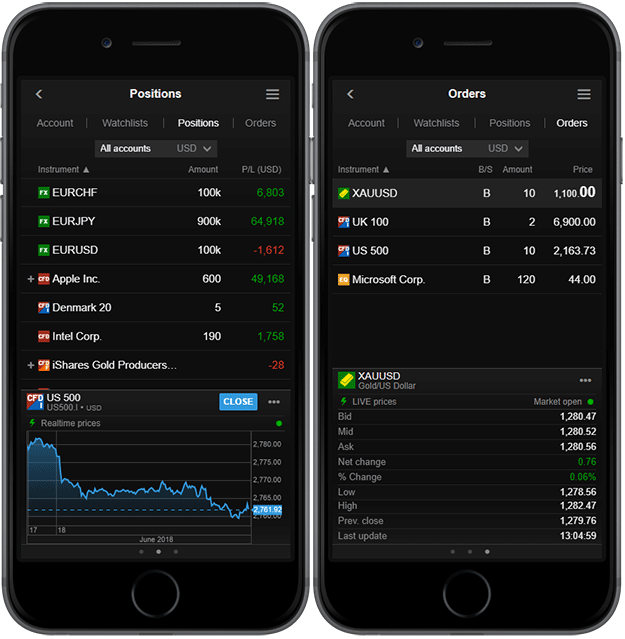
Redesigned Watchlists, Order and Positions

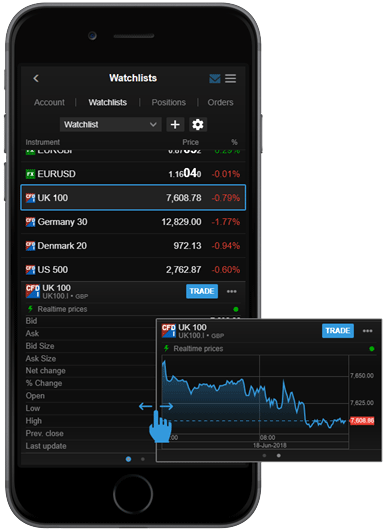
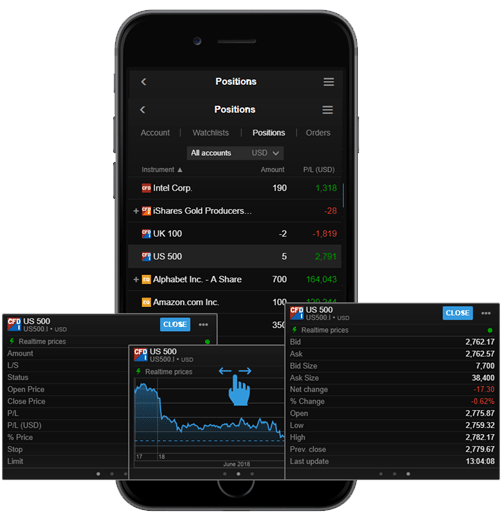
The Watchlist, Positions and Orders sections have been redesigned to offer a simpler layout, with easy access to detailed information through the use of info card which appear when you select an instrument.

The info cards allow you to swipe between key information for the position or order, a chart for the instrument and key market information for the instrument.

Account summary

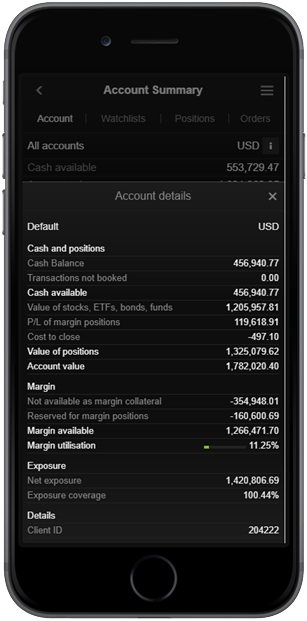
The Account Summary was also redesigned to give an overview of all accounts and easy access to details on a particular account.

Trade Ticket

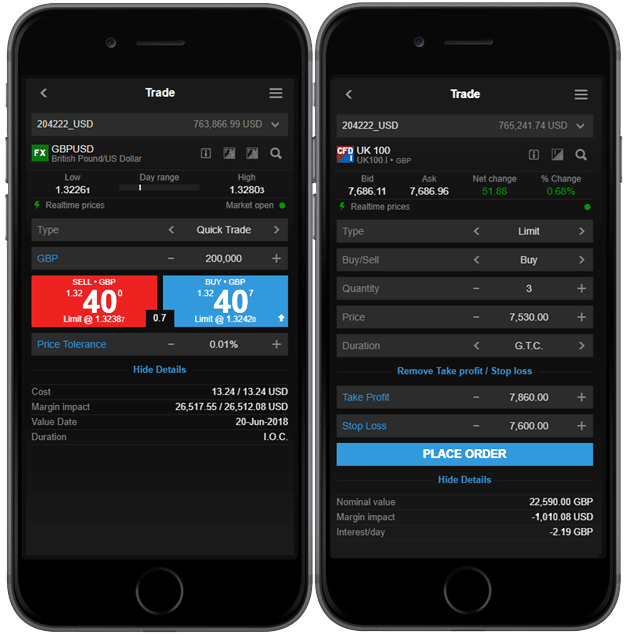
The new Trade Ticket has recently been introduced which is optimised for easier navigation and use on mobile devices with more touch-friendly controls.

Many other new features are coming to the GTS Mobile soon.

Second currency FX spot trading

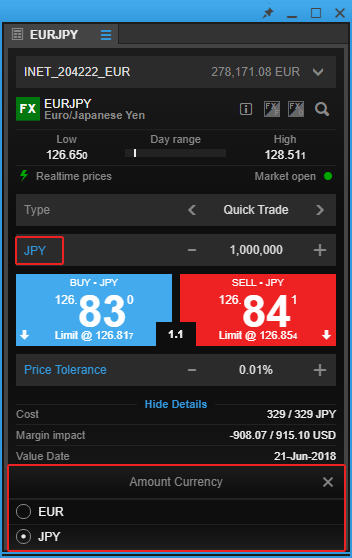
Trading in a second currency is now available in the GTS Web.

FX Quick Trades in the GTS Web now have a currency toggle on the amount selector, allowing you to select a second currency and set trade amounts in a second currency (the quote currency).

In this example, the Amount would normally be placed in EUR but you can now select to place the trade in JPY which will be converted to the EUR amount when you place the trade.

Please note that this is for convenience in converting trade amounts from the quote currency. The trade amount will always be placed in the base currency (EUR for EURJPY in this example).

Futures and futures options initial margin

Effective Monday, 9 July 2018 Global Trading LTD will improve the order checking of futures and options orders, so that the initial margin is used for the entire portfolio. The change only relates to pre-check of futures and futures options so clients without positions in these instruments are not affected.

Aggregated amounts tool

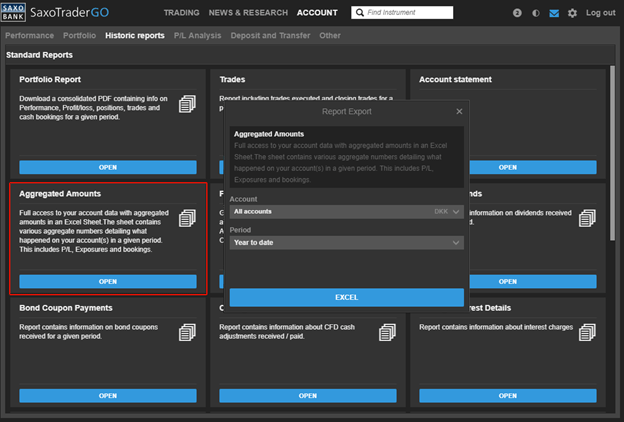
A new Aggregated Amounts tool is now available which exports aggregated amounts for your holdings into an Excel sheet. These include daily exposures, position values, P/Ls, costs and bookings and allows you to filter and process these amounts based on your own use cases.

The exported Excel sheet includes sections for:

  • Aggregated Amounts – a full list of relevant amounts affecting your accounts in the period
  • PL – The total P/L (realised +unrealised) per instrument per day
  • Cash movements –amounts that were booked on your account per day

Aggregated amount is available under Account > Historic reports > Aggregated amounts in the platforms.

Please note that this is for convenience in converting trade amounts from the quote currency. The trade amount will always be placed in the base currency (EUR for EURJPY in this example).

Chart improvements

Trendline annotations

Improved trendline annotations are now available in the charts in all platforms.

A number of changes have recently been made to the trendline annotation, available from the Annotations menu in the chart.

Trendline segment (Trendline)

The Trendline annotation has changed name to Trendline Segment which still draws a line between the two points on the chart.

Trendline ray (Infinite trendline)

Infinite trendline has changed name to Trendline Ray and still extends in one direction (forwards).

Trendline extended (new)

A new trend line named Trendline Extended is now available which extends to both the left and right.

Trendlines can be edited in the configuration settings for the trendline configuration settings where you can edit:

  • Line colour weight and type
  • Start and end points
  • Line extensions
  • Add parallel trend lines

Chart improvements from May 2018

See also: New chart features from June 2018

Trade Ticket margin impact changes

From late July 2018, we will be changing the methodology used to calculate margin impact values shown in Trade Tickets in all platforms:

  • Currently, the margin impact of a trade is based on the change in Margin available
  • From July 2018, the margin impact of a trade will be based on the change in Reserved for margin positions = Reserved for margin positions after trade – Reserved for margin positions before the trade

This change separates the margin impact from impact of costs and option premiums.

Operational Changes

Subscription Changes

Australian Securities Exchange subscription fee change

From 1 August 2018, Australian Securities Exchange Level 2 subscriptions will be raised from AUD 82 to 88 for professional clients.

June 2018 New Products & Platform Updates

Product Updates

Quick trade

Quick trading from the chart

Two new buttons have been added to the chart toolbar giving access to:

  • Instruments where quick trading is available, quick trading as either a market or limit order with price tolerance

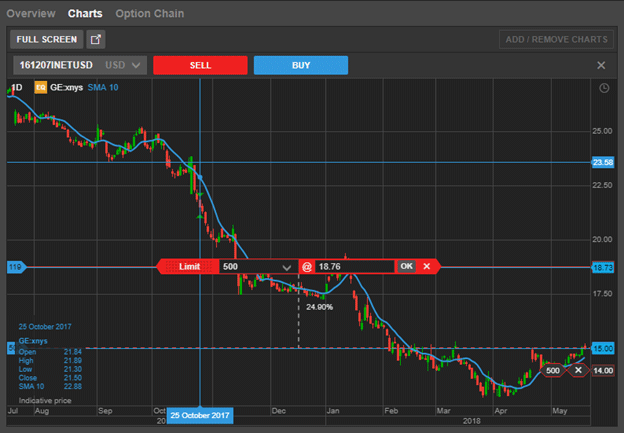
  • Placing orders on the chart

The button gives access to quick trade the instrument as a market order or limit order with price tolerance.

Click the amount to the left of the buy/sell quick trade buttons to select the trade amount. Click the Tolerance to the right of the buy/sell buttons to edit price maximum tolerance you are willing to accept.

To close the edit amount and tolerance clicking the fields again

Placing orders

Placing orders in the chart is now available using the order button

Position summary

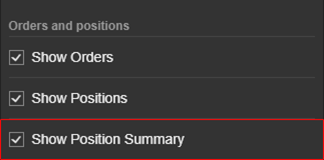
A position summary is now also available in the chart that shows your current net position on an account, the current P/L on the account and the number of open orders.

To enable/disable position summary

The position summary can be enabled/disabled using the Show Position Summary checkbox in the chart settings.

New Chart Types

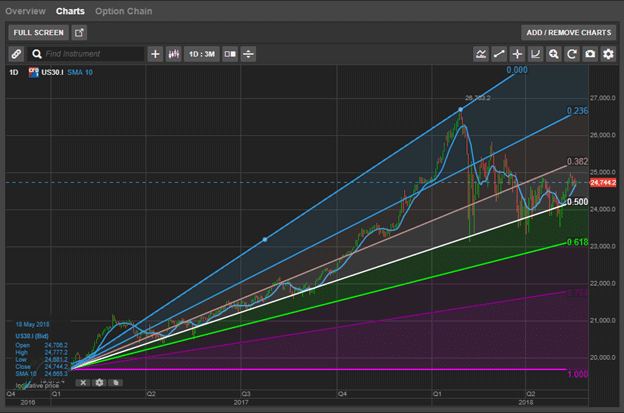
Fibonacci fan

A new indicator, Fibonacci fan, is now available from the Annotations menu.

Fibonacci fans can be both rising or falling trend lines based on Fibonacci retracement levels. Fibonacci fan lines and can be used to estimate support and/or resistance levels in the financial markets.

The default Fibonacci ratios are the same as used in the other Fibonacci annotations available in the charts.

Weighted Close (WTC) indicator

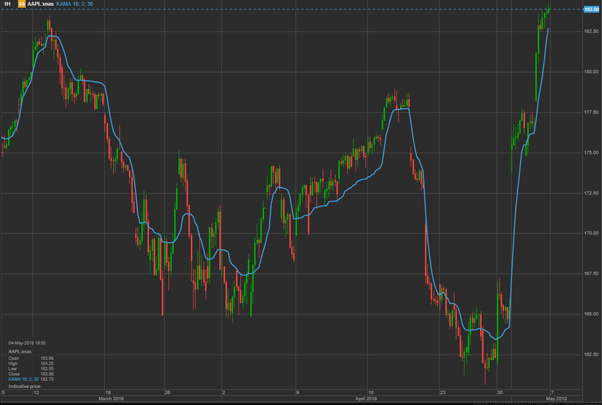
Two new Indicators are now available from the Indicator menu. Weighted Close (WTC) and Kaufman’s Adaptive Moving Average (KAMA).

The Weighted Close indicator is now available from the indicators menu and is another way of looking at the price data of exchange-traded instruments. The weighted close price is an average of the price for the chart period, placing a greater emphasis on the closing price rather than the high and low. The Weighted Close indicator is calculated by multiplying the close by two, adding the high and the low to this product, and the result dividing by four. As there is only one price for Weighted Close it is shown as a line.

As you can see from the Apple chart below, the ‘normal’ close and the weighted close differ most of the time.

Kaufman’s Adaptive Moving Average (KAMA)

Kaufman’s Adaptive Moving Average (KAMA) was developed by Perry Kaufman and is a moving average, trend-following indicator that can be used to identify price turning points. It is designed to take market noise and volatility into account so that if volatility is high, the KAMA will be farther away from the current price confirming the trend and when a trend may be coming an end, the KAMA value will be closer to the market price.

The KAMA indicator differs from other moving averages such as Exponential Moving Averages which uses a weight variable, by using a constant called the ‘efficiency ratio’ to measure the strength of a trend.

Product Enhancements

Improved auto-logout time for mobile GTS-web

By popular request, the automatic logout time for mobile GTS-Web has been extended from 10 to 30 minutes.

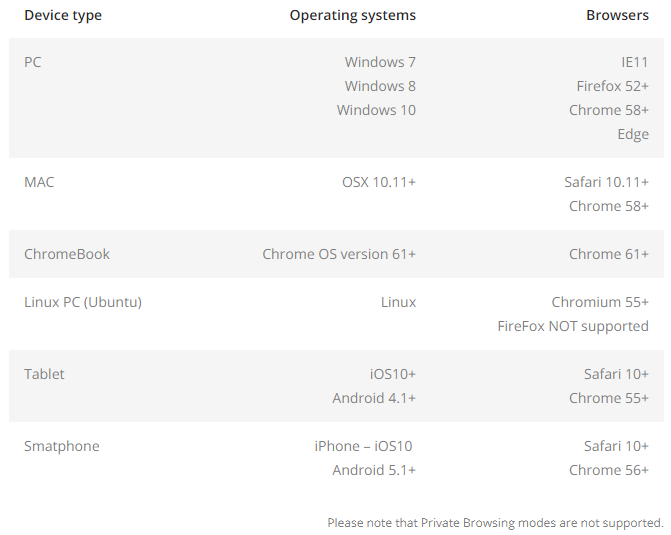
Minimum browser requirements for GTS-Web


Operational Changes

Subscription Changes

Hang Seng Indices subscription fee change

From 1 July 2018, Hang Seng Indices Level 1 subscriptions will be raised from HKD 45 to 54 for both private and professional clients.

May 2018 New Products & Platform Updates

Real-time netting available from May

We are pleased to announce the release of real-time netting of positions in the positions list from May.

Real-time netting simplifies position management by dedicating your Positions list to open positions, moving closed and partially closed positions to a new Closed positions module until they are processed at the end of the day.

Real-time netting uses first in, first out (FIFO) netting where trades are closed in the order they were opened.

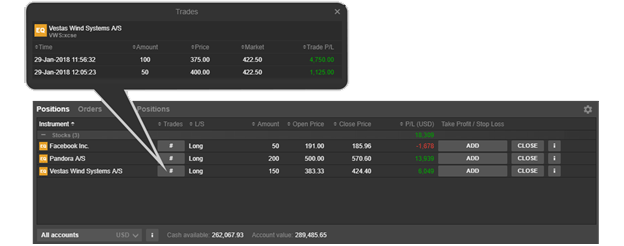
With real-time netting, you manage your net positions instead of individual trades. Individual trades can be seen in the new trades dialog.

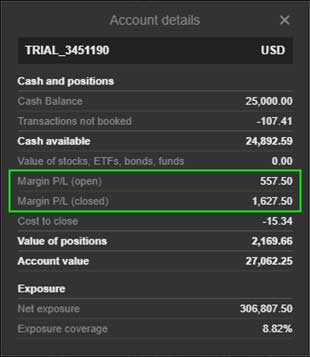
Open and closed margin P/L

With real-time netting enabled, margin P/L is split into its open and closed components.

Take profit and stop loss

Take profit and stop loss orders cannot be attached to individual trades. Independent take profit and stop loss orders can be placed instead and managed separately — if you close a position, you must also manually cancel any orders relating to the position.

Enable real-time netting

Enable real-time netting on your account in the settings in all platforms. The feature can be enabled/disabled at any time.

Works with all instruments

Real-time netting is supported by all instruments – margin and cash-traded.

Works in all platforms

Real-time netting works in all platforms – GTS and GTS Pro.

Update to GTS Mobile Platform

During the month of May, a number of updates will be coming to the GTS mobile platform. The updates will include:

  • Redesigned watchlist, orders and position pages

    These pages have been redesigned in order to provide a simpler, cleaner layout, highlighting key data while providing quick access to more detailed information through the use of card navigation

  • Card navigation

    The introduction of cards that display contextually relevant data and actions, will make navigation even easier for the user

  • Updated trade and order tickets

    This design upgrade introduces a new, condensed ticket layout with more touch friendly navigation elements. This ticket upgrade will also be introduced on GTS for desktop and tablet in the near future

Discontinuation of stocks and options

Due to the heightened risk associated with options on rated 5 stocks and ETP (ETF, ETC and ETN) options that may themselves be leveraged, we have decided to discontinue support for selling rated 5 options on stocks and ETPs. The change will take effect on Tuesday, 15 May 2018. Clients with existing short positions will not be affected but will be unable to open new short positions.

March 2018 New Products & Platform Updates

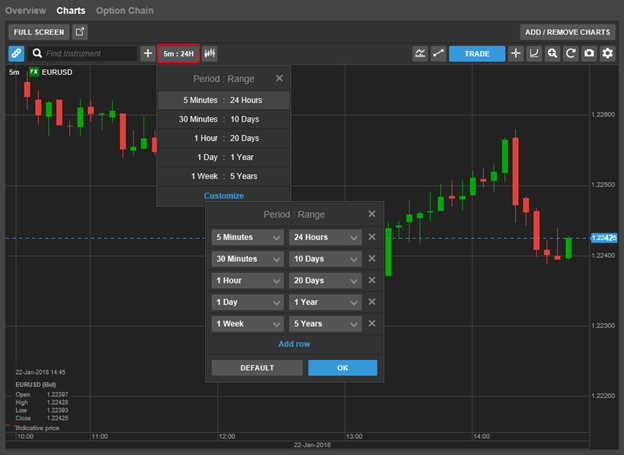
Time Range Selector

In mid-February 2018 we will be launching a new time range selector for the charts in GTS-Web, allowing you to select a time range as well as a period.

Click on Customise to customise your own period and time ranges – you can have up to 10 default combinations.

Click on Default to reset all combinations to the defaults.

Market Data Changes from March 1st, 2018

Dow Jones and S&P Stock Indices Subscription Fee Change

Dow Jones and S&P Stock Indices will increase their fees for market data access from 1 March 2018:

Service Level Status Current Price New Price
Dow Jones and S&P Stock Indices Delayed Private 2.50 USD 3.50 USD
Dow Jones and S&P Stock Indices Delayed Professional 2.50 USD 4.00 USD
Dow Jones and S&P Stock Indices Level 1 Private 4.00 USD 5.00 USD
Dow Jones and S&P Stock Indices Level 1 Professional 4.00 USD 6.00 USD

SIX Swiss Exchange Subscription Fee Change

SIX Swiss Exchange Level 2 subscriptions will be raised from 56 to 90 CHF for private clients from 1st March, 2018.

March 2018 New Products & Platform Updates

Market Data Changes from April 1st 2018

GLOBEX (CME, CBOT, COMEX, NYMEX) subscription fee changes for professional clients

GLOBEX (CME, CBOT, COMEX, NYMEX) will be increase fees for market data access for professional clients from 1st of April 2018:

Subscription Level Status Current Price New Price
GLOBEX (CME, CBOT, COMEX, NYMEX) Level 1 Professional 340 USD 420 USD
GLOBEX (CME, CBOT, COMEX, NYMEX) Level 2 Professional 340 USD 420 USD
CME Level 1 Professional 85 USD 105 USD
CME Level 2 Professional 85 USD 105 USD
CBOT Level 1 Professional 85 USD 105 USD
CBOT Level 2 Professional 85 USD 105 USD
COMEX Level 1 Professional 85 USD 105 USD
COMEX Level 2 Professional 85 USD 105 USD
NYMEX Level 1 Professional 85 USD 105 USD
NYMEX Level 2 Professional 85 USD 105 USD

Closed Position Report

The popular Closed Positions report was recently reintroduced in the account section, giving an overview of all positions closed in the period.

The Closed Positions report is a valuable report for accounting and tax purposes, giving access to details of a closed position in both the instrument and account currency.

The Closed Positions report is available under Account > P/L Analysis > Closed Positions in the platforms.

January 2018 New Products & Platform Updates

Time Range Selector

In mid-February 2018 we will be launching a new time range selector for the charts in GTS-Web, allowing you to select a time range as well as a period.

Click on Customise to customise your own period and time ranges – you can have up to 10 default combinations.

Click on Default to reset all combinations to the defaults.

Market Data Changes from March 1st, 2018

Dow Jones and S&P Stock Indices Subscription Fee Change

Dow Jones and S&P Stock Indices will increase their fees for market data access from 1 March 2018:

Service Level Status Current Price New Price
Dow Jones and S&P Stock Indices Delayed Private 2.50 USD 3.50 USD
Dow Jones and S&P Stock Indices Delayed Professional 2.50 USD 4.00 USD
Dow Jones and S&P Stock Indices Level 1 Private 4.00 USD 5.00 USD
Dow Jones and S&P Stock Indices Level 1 Professional 4.00 USD 6.00 USD

SIX Swiss Exchange Subscription Fee Change

SIX Swiss Exchange Level 2 subscriptions will be raised from 56 to 90 CHF for private clients from 1st March, 2018.