Chart Improvements in TradeStation
Pop-out chart (multi-screen) support:
The chart in the Global TradeStation platform can now be opened in a separate browser window and located on a separate screen.
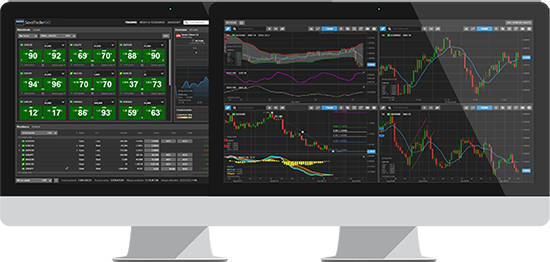
New studies will be available mid-January 2016
Donchian Channel
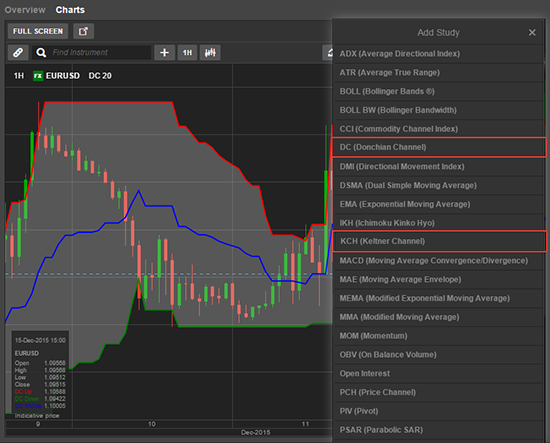
Donchian Channel is a trend-following breakout study developed by Richard Donchian consisting of two bands derived from the highest high and lowest low over a defined period (default 10 periods).
The Donchian channel offers information about volatility – Bollinger Bands. The more the price fluctuates the wider the bands. Most traders, however, use it to establish long positions when the price breaks above the upper band or short positions when the price breaks below the lower band.
Keltner Channel study
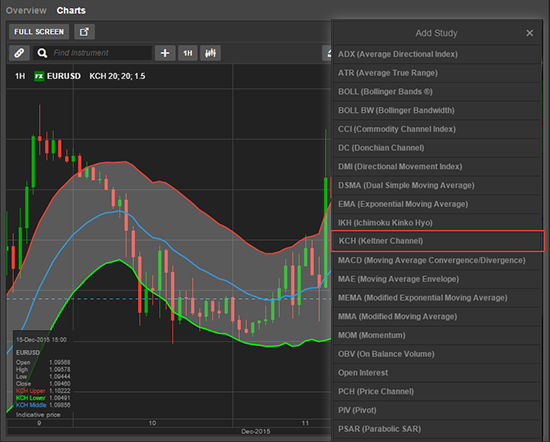
Keltner Channel is a volatility study developed by Chester Keltner. The study is very similar to Bollinger Bands but where Bollinger Bands use standard
deviation to determine the bands, Keltner channels are based on the Average True Range (ATR). Bollinger Bands draw the bands around a Simple Moving Average
whereas Keltner use an Exponential Moving Average.
Keltner channels can be used to identify trends, reversals, breakouts, overbought and oversold levels.
Studies on studies:
From 16 January 2016, the chart in GTS will support studies on studies, for example, making it possible to add a Moving Average on a Volume.
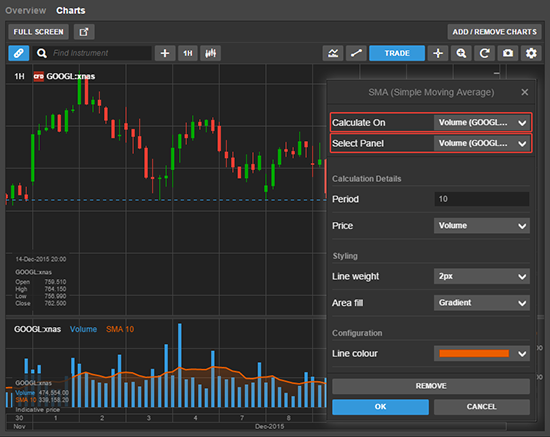
In the study configuration dialogue, the trader will be able to select which chart panel he wants the study to appear in or to choose a new panel.
Shared Price Axis
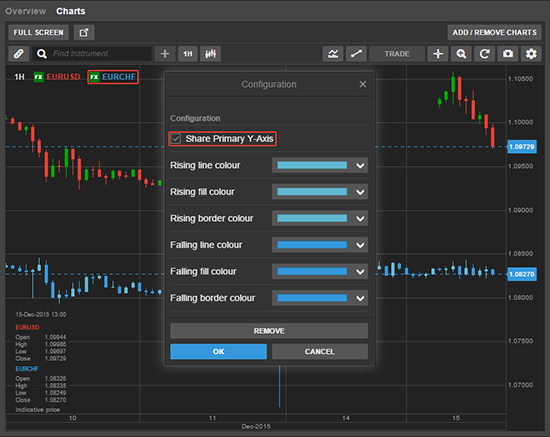
From 16 January 2016, the chart in GTS will allow the display of two instruments on the same chart sharing the Price Axis (Y Axis) between the two charts.
Instrument Search Improvements in GTS
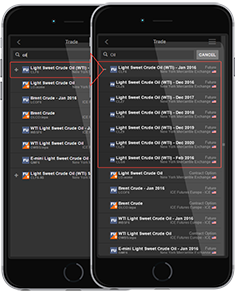
Search in the GTS platform has been improved by collapsing secondary listings of an instrument beneath a primary listing:

- Simplifying the search results
- Making it easier to select primary listings
- Offering easy access to secondary listings by un-collapsing the results.
Secondary stock listings
Secondary stock listings are collapsed beneath the primary listings.
Futures contract expiries:
Different Futures expiries are collapsed beneath the front-running contract (with the nearest expiry).
Futures Spread months:
Different month combinations of Futures Spreads are collapsed beneath the front-running Spread (with the nearest expiry).
New Features in GTS Pro
Improvements to FX Liquidity Depth:
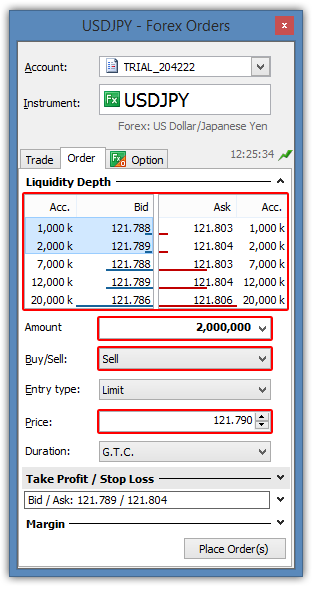
Forex trade tickets have now been enhanced with interactive Liquidity Depth.
- Each row shows the price levels available for accumulated amounts
- Horizontal bars indicate the relation of the amounts at each level
- Clicking a level populates an aggressive Limit Order with:
- Sell for Bid/Buy for Ask levels
- The price at that level
- The accumulated amount at that level.
Chat in GTS and GTS Pro
The chat module is now available in GTS and GTS Pro. This would be the most convenient and direct channel for addressing issues related to trade execution. Our support staff will be available to help answer questions and/or direct you to the best channels to resolve them.

Trading from the Watchlist, Trade Board and Forex Board:
We have recently improved trading support from Watchlists, Trade Boards and Forex Boards in GTS Pro:
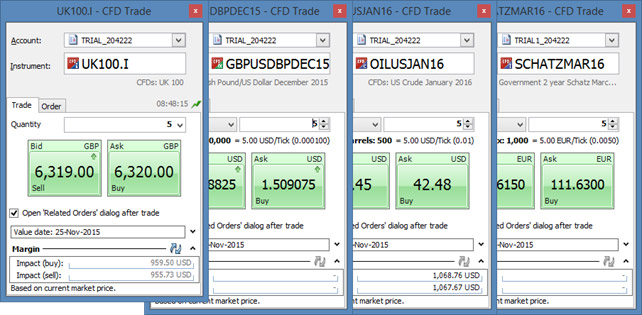
- Instruments with non-green prices (yellow or purple prices) will now launch a trade ticket for the instrument.
- Instruments with green prices will continue to execute on the live price.

Changes to Unrealized Margin Profit/Loss Calculation
From 1 February 2016, the Unrealized margin profit/loss shown throughout the platform will include conversion fees for FX, CFDs & Futures making it a more accurate representation of the P/L on the client’s account. This change to the Unrealized margin profit/loss will affect the client’s Account value and Available for margin.
All Stock CFDs Routed Directly to Market (Reminder)
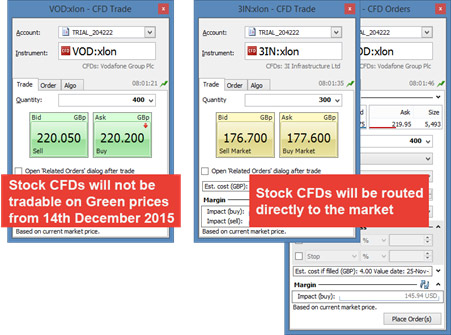
As announced in December Notification, due to the improvements in speed of execution, Smart Routing and changes in the regulatory environment, Euro Pacific Bank is no longer a Market Maker for stock CFDs since 14 December 2015. Instead, we are offering stock CFDs on a pure Direct Market Access (DMA) basis where all stock CFD orders are routed directly to the market.
This means that stock CFDs are no longer available on Live (green) tradable prices but are traded through Market, Limit and Stop orders.
Non-stock CFDs not affected
Trading in other CFD types will be unaffected and will continue to be available on live green prices including:
- CFD Indices
- CFD Commodities
- CFD Forex
- CFD Interest Rates and Bonds.
Side-based P/L Calculations for Forex (Reminder)
From January 2016, P/L on open Forex positions shown in Positions lists will be calculated using the actual Bid or Ask close price instead of the mid-price in all GTS. This means that:
- The close price shown in the Positions list will show the price to close the position (Bid for long position, Ask for short positions)
- P/L will be calculated using the Bid/Ask close price
- % Price will be calculated using the Bid/Ask close price.
- This will give a more accurate representation of the P/L that will be booked on the account.
If you have any questions, please contact [email protected]
