Product Updates
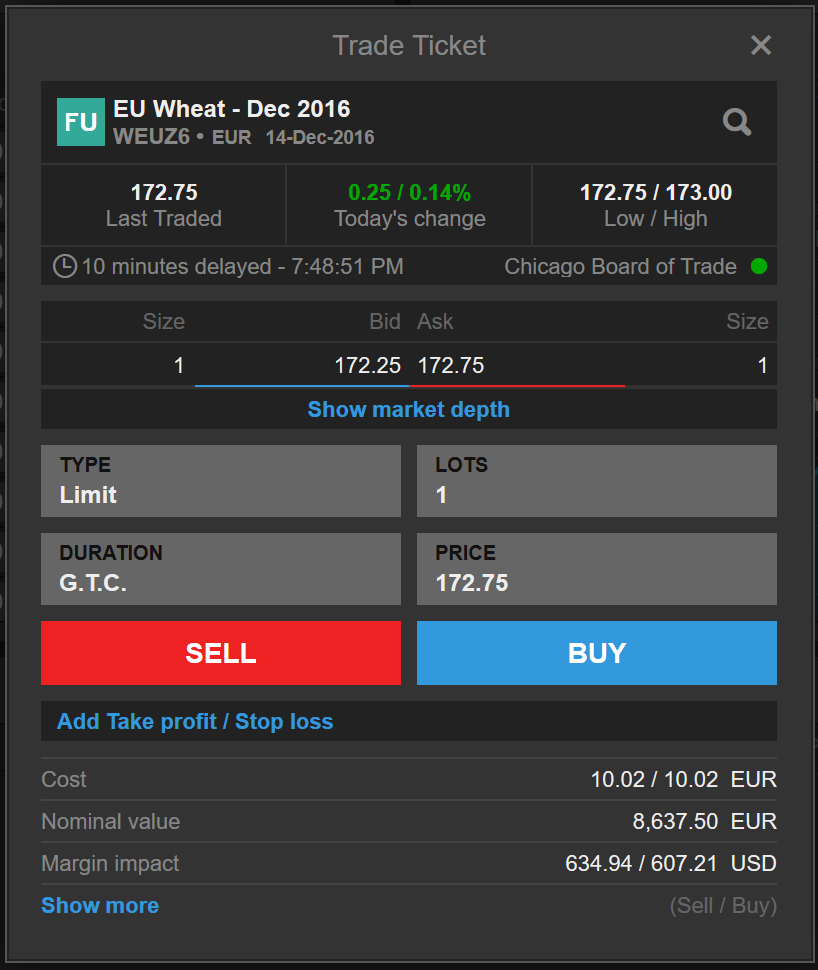
European Wheat Futures contract from CME now available
EU Wheat Futures contracts (WEU) from CME are now tradable through the trading platforms.
Weekly Equity Index Options on Futures
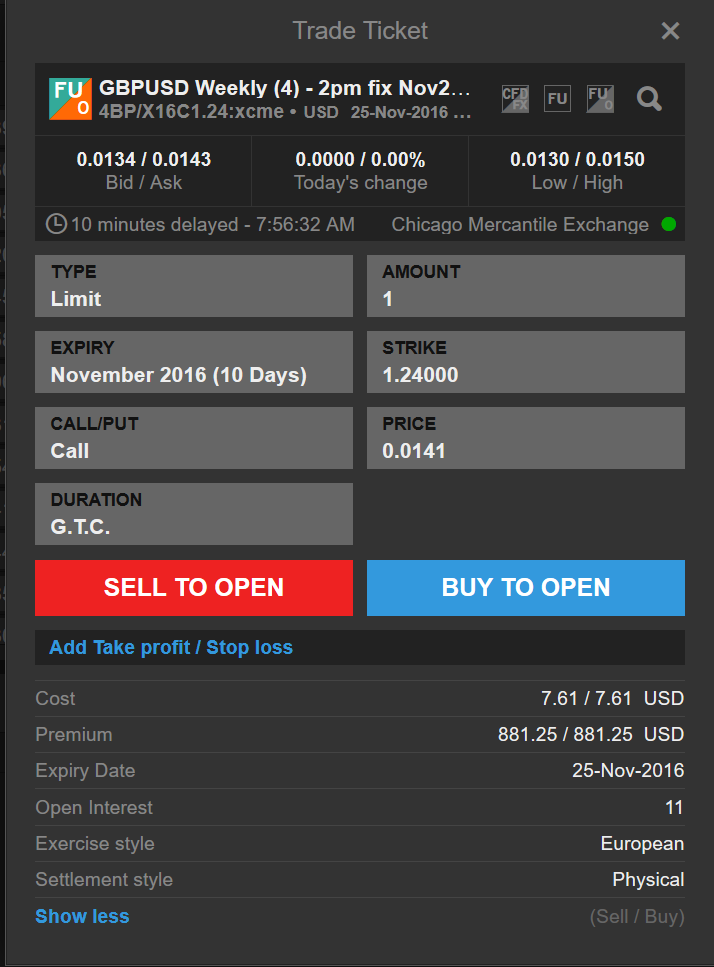
The CME Group is now offering Weekly Equity Index Options on futures at a lower cost than standard option expiries. This allows an alternative to quarterly offerings with lower cost premiums. We have added the E-mini S&P 500 weekly options, along with a Wednesday expiry option in GTS. We will be looking to add more offerings to the platform in the near future.
G6 FX Futures Options converting to European-style options
CME is moving from American-style to European-style on G6 FX Futures options. Weekly options and monthly options with expiries in 2017 are now traded as European-style options.
- Six major premium-quoted European-style FX Futures options will replace American-style premium-quoted options
- American-style FX options currently listed on these six major FX will expire at their currently scheduled expiries
- Any new monthly listings will be listed as European-style options
- European-style weekly, monthly and quarterly options on AUD/USD, GBP/USD, CAD/USD, EUR/USD, JPY/USD and CHF/USD will exercise into the nearest quarterly Futures contract
Platform Enhancements
Options Chain Now Available
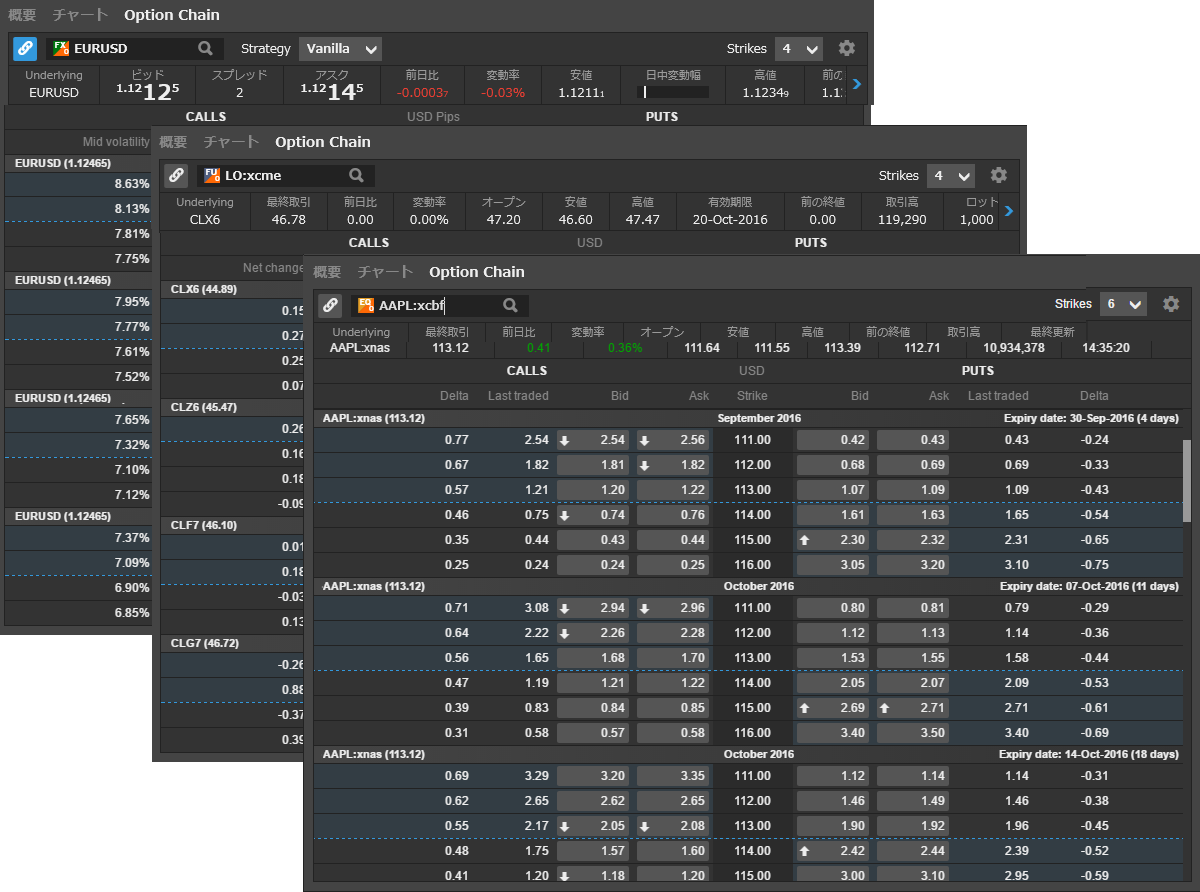
The new Option Chain allows trading of FX Options and Exchange Traded Options on stocks, indices and futures.
Features of the new Option Chain include:
- Option Chain can be linked to the Watchlist, allowing fast switching between instruments from the Watchlist
- FX Vanilla and FX Touch Options
- In-the-money highlighting of strikes
- Shows the underlying instrument price information
- Customizable number of strikes shown for each expiry
- Customizable columns, including Greeks and volatilities for US stock options
New Chart Features
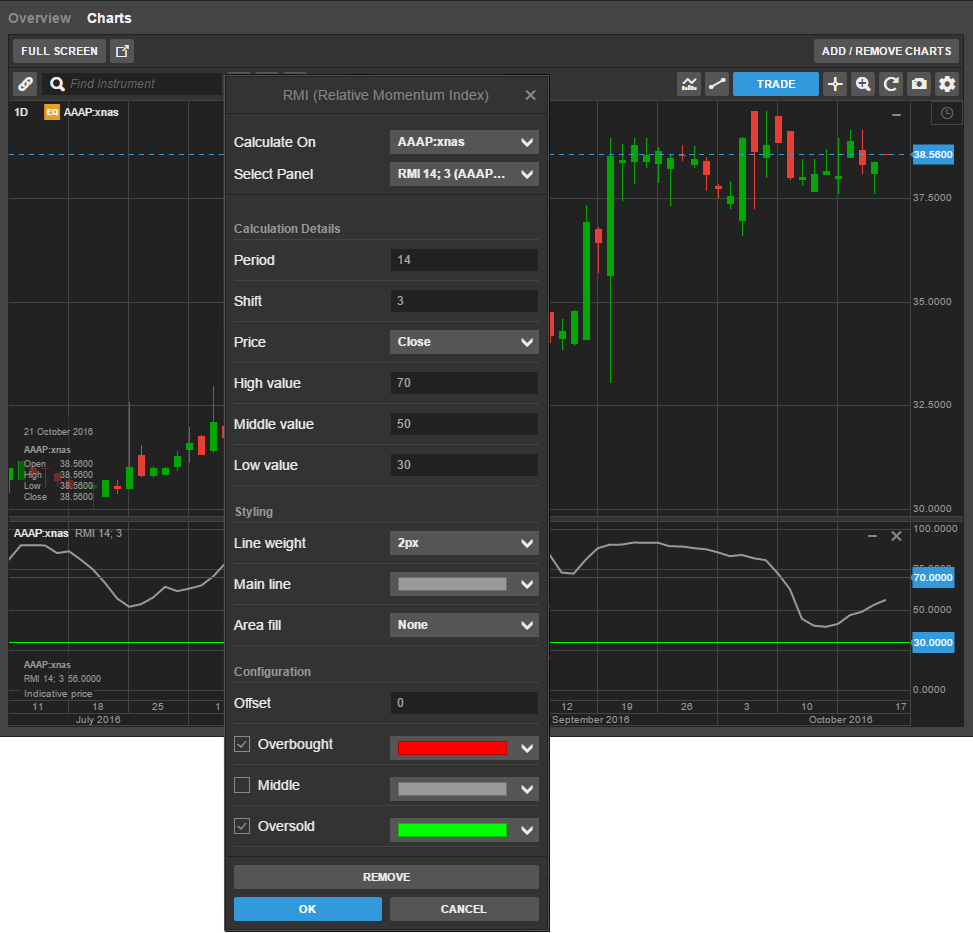
New technical indicator – Relative Momentum Index
Developed by Roger Altman, the Relative Momentum Index (RMI) is a variation of the Relative Strength Index (RSI), but where RSI counts days using closing prices only, RMI counts from todays close relative to the close n days ago.
The RMI smooths volatility more than the RSI, and the longer the time intervals the smoother the RMI line.
Similar to the RSI, the RMI has a range of 0 to 100, with values typically of between 30 and 70. Values above 70 can indicate overbought conditions, while values below 30 can indicate oversold conditions.
New technical indicator – Closed Colour Volume (CCV) on Volume indicator
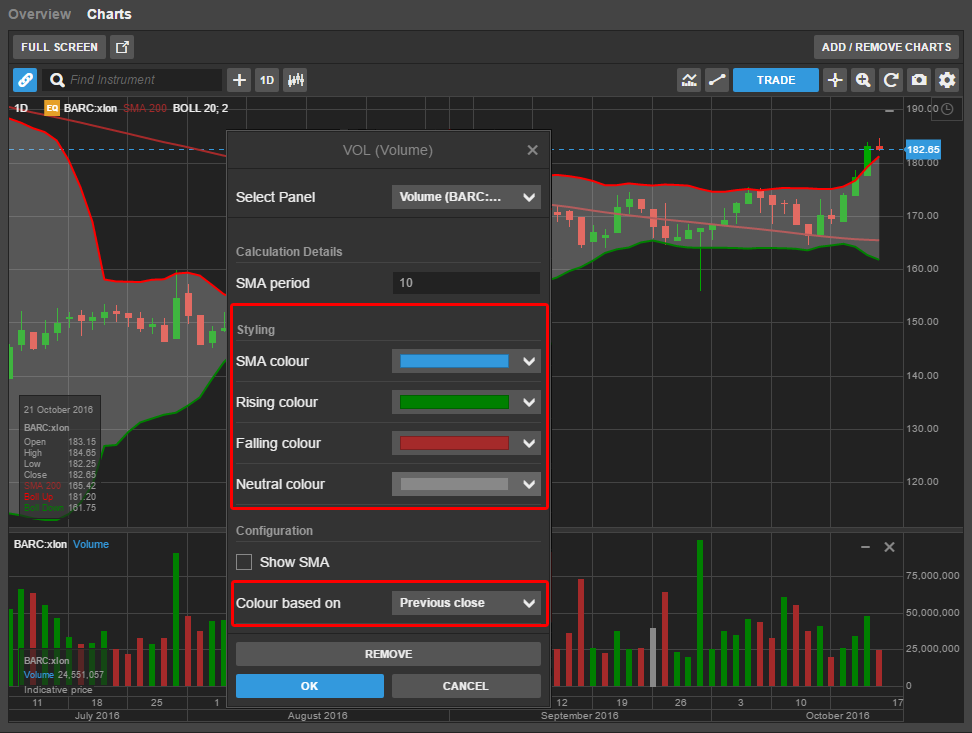
Closed Colour Volume (CCV) is now available on Volume (VOL) studies which colours Volume bars according to whether the price closes up or down in the period. By default, up day volumes are green, down day volumes are red, and no change volumes are grey. You can customize these in the settings for the study.
The ìColour based on option allows you to select whether the volume is coloured based on between Previous close or Current open.
Annotations – Vertical line date/time label
A label annotation is now available in the settings of the Vertical line annotation which displays the date and time on the x-axis.

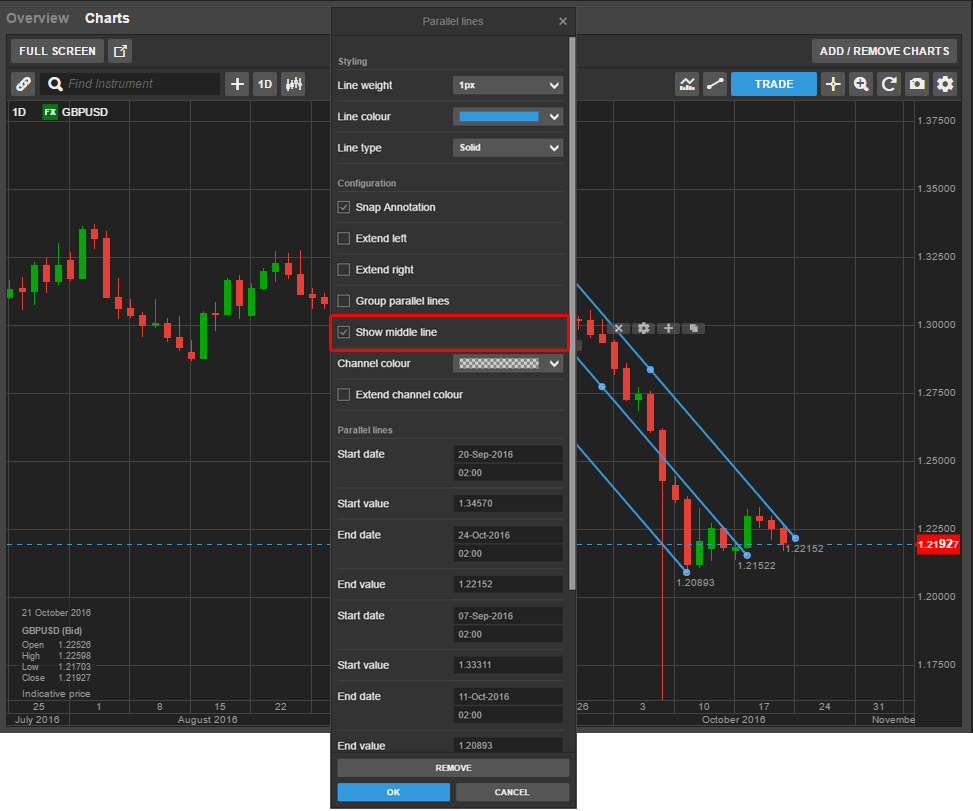
Annotations – Add mid-line on Parallel lines
A middle line can now be added to the Parallel lines annotation by checking the ìShow middle line checkbox. The area between the two parallel lines can also be coloured now by selecting the Channel colour option.
Changes to trading from the Watchlist
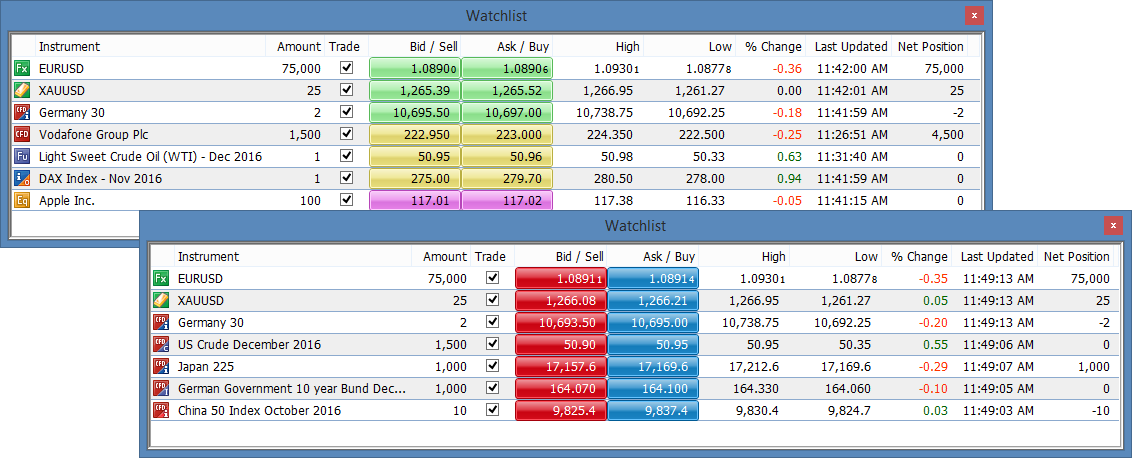
When subscribed to live prices for an instrument, the Watchlist, now directly places a market order when clicking the Bid/Ask button for Stocks, Stock CFDs, Futures and ETOs.
For instruments on delayed prices, the Watchlist will continue to launch a Trade Ticket.
