Product Updates
You can now get exposure to Bitcoin
Interest in cryptocurrencies has grown exponentially in 2017 thanks in large part to increased supply and demand in China and Japan. As a result, traders have increasingly yearned for a product which enables them to speculate on the price of Bitcoin, the original and most well-known cryptocurrency.
Two New ETNs
GTS clients can get exposure to Bitcoin through two new Exchange Traded Notes (ETNs) designed to track the movement of Bitcoin against the US Dollar (BTC/USD).
‘Bitcoin Tracker One’ is traded in Swedish Krona (SEK) and ‘Bitcoin Tracker EURO’ is traded in Euro (EUR). Both ETNs are issued by XBT Provider AB and traded on Nasdaq OMX (Stockholm).
If you are subscribed to these exchanges, the Bitcoin trackers will be enabled automatically on your platform. Note that due to low liquidity it is possible that quotes for these instruments will be unavailable. In that case the instrument is still tradable using a market order, but you should consult the relevant exchange to determine the current price before placing such a trade.
How to find Bitcoin in the platform?
The easiest way to find the new instruments is by searching for “bitcoin” in the trading platform. The ETNs will appear in your search result list.

| Product Type: | Certificate (Exchange Traded Note) |
|---|---|
| Symbols: | BITCOIN_XBT:xome (SEK) / BITCOIN_XBTE:xome (EUR) |
| Exchange: | Nasdaq (Stockholm) |
| Issuer: | XBT Provider AB (publ) |
| Underlying asset: | Bitcoin nominated in USD |
| Leverage: | 1:1 |
| Expiry date: | Open-ended |
| Annual fee: | 2.5% |
| Fact Sheet: | Click here |
| Issuer website: | Click here |
Risk Warning
Please ensure you understand the risks involved in trading ETNs, including credit-, liquidity- and market risk before starting to trade these products.
FX orders will now be triggered on an independent ECN price feed
By replacing the underlying feed used to trigger resting orders from our own price feed to an independent ECN price feed, that offers a combination of bank and non-bank liquidity, we contribute to the reliant and effective functioning of the global wholesale FX market.
In addition, and further to the introduction of Order Driven Execution in November 2016, which provides a safer and more efficient way to fill client orders, we now route all Stop orders externally to be filled against ECN liquidity as a first priority. This is a safety precaution to ensure an accurate fill in line with the actual liquidity and market depth when faced with very directional client flow.
Why have we done this?
Because it is potential challenge in event driven and/or disorderly market scenarios, we want to move away from bank price feeds that are indicative last look quotes with the bank interest and internal risk appetite built in. An ECN price feed provides a much broader, neutral and firm set of liquidity (including bank and non-bank providers), in which prices are more consistently present both in good times and in disorderly or illiquid markets.
Change to the settlement cycle for Canadian and US equities
The Canadian and US equities markets will move from a T+3 to a T+2 settlement effective from 5 September 2017.
For more information you can visit : http://www.ust2.com/pdfs/T2-Conversion-WhitePaper.pdf
Product Enhancements
Coming soon: New Account section in GTS
We are happy to announce a completely redesigned Account section will be launched soon in GTS.
In the New Account Section:
- New Performance Overview offers detailed analysis of P/L, % returns and the cash balance of selected accounts for a selected period.
- P/L Analysis Tools allow you to analyze P/L, associated costs and bookings down to the product and instrument level in detail. Analyze your P/L by trading product, specific instruments or sectors, charting the cumulative P/L graphically or itemizing transactions associated with a product or instrument.
- New Portfolio Summary gives an overview of your current net holding and offers a historic view of your holdings at the end of a selected day.
- Other Account enhancements include simplified navigation and improved layout of reports; cash transfer tools and other account services.
More details to follow in future updates.
Improvements to “Transactions not booked”
From the 15 September 2017, “Transactions not booked” in Account Details will be expanded to include provisional amounts that are calculated daily, but booked monthly. Provisional amounts will include:
- CFD finance
- Futures, CFDs on Futures and listed options carrying costs
- Option holding fees
CFD Finance and Interest calculations details will continue to be available in the detailed reports.
We are making these improvements in an ongoing effort to improve the user experience and accuracy of account value details.
Upcoming Upgrade to GTS Pro
In September 2017 an upgrade to the desktop application, Global TradeStation Pro will be released. This upgrade cannot be installed on Windows XP and Windows Vista. Consequently, we are ending support for GTS Pro on these operating systems by mid-November 2017. The upgrade will be optional for 60 days, but must be installed from mid-November. At that point, it will no longer be possible to use the platform on Windows XP and Windows Vista.
New Chart Indicators
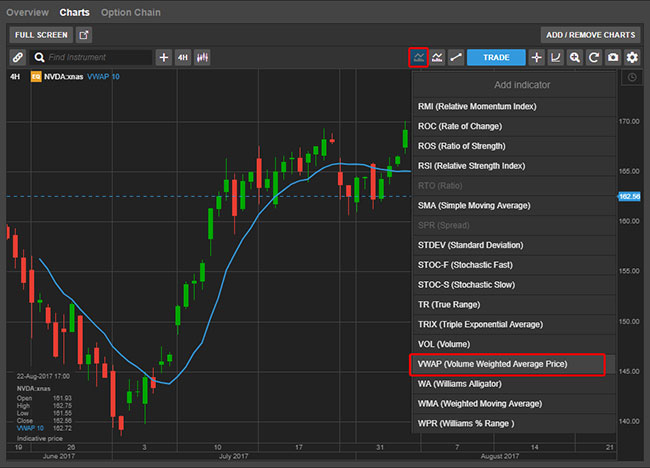
Two new indicators are now available in the Chart in the GTS platform:
Volume Weighted Average Price (VWAP)
Volume Weighted Average Price (VWAP) is a technical indicator used to measure the average price on an instrument (typically a stock) against the traded volume over a particular time frame.

VWAP is a chart overlay similar to a moving average. VWAP is mostly used on intraday time periods (typically 5 minutes and 1 hour) to determine the general direction of a price move or trend. VWAP only works with Exchange traded instruments where there is an official traded price with volume i.e. Equities and Futures.
Instead of placing a single large order in the market, active traders often use VWAP to trade large volumes in line with the general volume and price of the intraday market in an effort not influence the general market price too much. Skilled VWAP users can often buy a large portion of their shares below the VWAP and sell above.
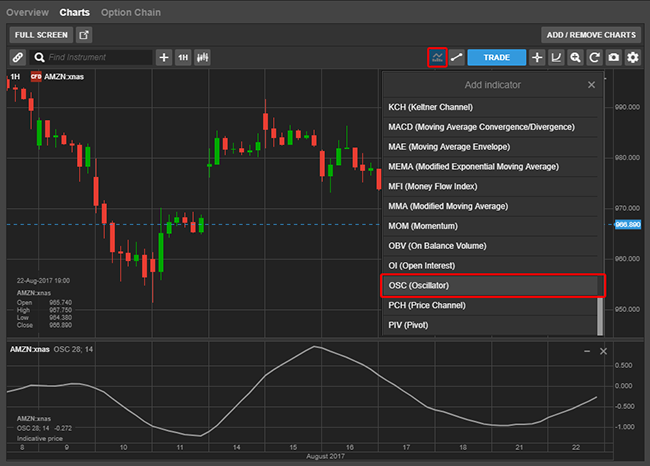
Oscillator (OSC)
The Oscillator (OSC) indicator can be used as a trend indicator. It charts the relationship between two moving averages (typically 28-day and 14-day averages).

Buy signals:
- The Oscillator line crosses and moves above the zero line (when there is no difference between the fast and slow MAs)
- Strong positive divergence (when the price is trending downwards but the Oscillator is trending upwards – this can be interpreted as bullish, suggesting a that recent down trend may be nearly over)
Sell signals:
- The Oscillator line crosses and moves below the zero line (when there is no difference between the fast and slow MAs)
- Strong negative divergence (when the price is trending upwards, but the Oscillator is trending downwards – this may be interpreted as bearish, suggesting that recent up trend will not continue)
Signals are more reliant on the direction of the underlying long-term trend — confirmation of signals using other indicators is advised.
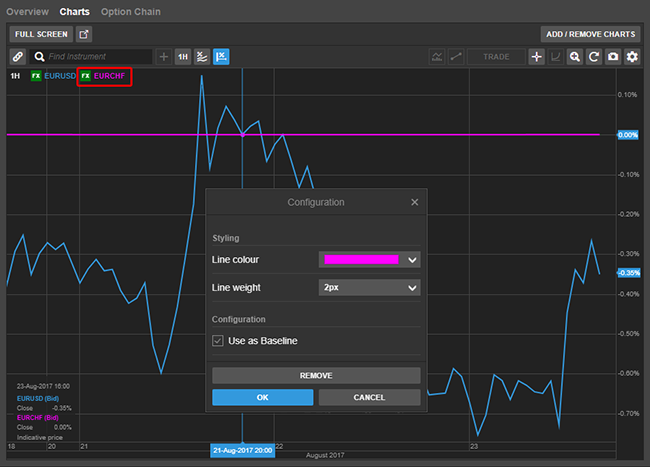
Improvement to % Comparative chart
We have improved our % Comparative chart where you can now use one of the instruments as baseline
When comparing 2 instruments in Comparative mode, select Use as Baseline from the menu for the instrument – the instrument will be set as the reference (zero line) and percentage changes for the other instrument calculated relative to it.

