brokerage
Table of Contents
Portfolio Overview
P/L and Cash Movements Tools
New Portfolio Overview
New Navigation
Historic Reports
Deposit and Transfer
Other Account Functions
Portfolio Overview
The new Performance Overview offers a dashboard showing your Account Performance, percentage returns and changes in cash value of the account (or all accounts) for the selected period
Account Summary
The Account Summary includes the:
- Account Value at the start and end of the selected period and the Change in Account Value
- P/L related to trading activities (trade P/L, costs, financing, corporate actions etc.)
- Non-trading related bookings such as cash and security Transferred (interest, exchange subscriptions, exchange rate movements, etc.)
Account Value chart
The development of your account value over the selected period including cash and security transfers and everything booked on the account.
Instrument P/L
The Instrument P/L tab gives access to P/L breakdown for the selected account(s) and period.

P/L figures In the Instrument P/L section include:
-
Realized gains and losses (positions closed in the period)
-
Unrealized gains and losses (positions still open at the end of the period
-
All trading costs associated with a position such as holding costs, financing charges, rollovers, corporate actions, coupons, etc.
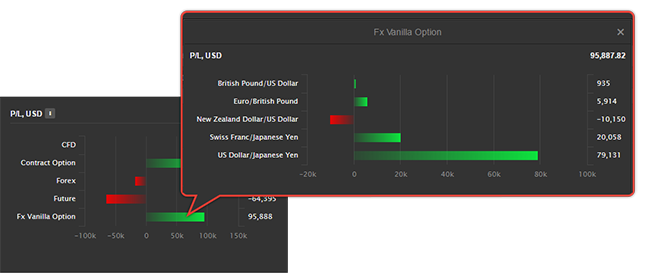
P/L Bar Chart
The P/L bar chart shows the net P/Ls for each product traded in the period.
Click on a bar to show the P/L breakdown for individual instruments traded in the period.
Top 3 Gainers and Losers
Top 3 Gainers and Losers show the 3 instruments with the greatest gain and loss in the selected period.
Cumulative P/L chart
The Cumulative P/L chart shows the development of the P/L on the account(s).
Monthly Return table
The monthly returns table shows the P/L by month since the account was opened.
Returns
Returns gives access to % returns for the selected account(s) and period:

%Return Chart
The % Return chart shows the development as the time-weighted percentage performance over the period excluding cash and security transfers.
Winning % Indicators
- The percentage of days in the period where your account had a profit/loss.
- The percentage of closed trades in the period with a profit/loss.
Statistics
Account statistics for the selected period.
Monthly % returns table
The monthly returns table shows the % returns by month since the account was opened.
Cash
The cash panel shows the development of the cash balance for the selected account(s) and period.

Cash Balance Chart
The % Return chart shows the development in the end-of-day cash balance over the period including cash and security transfers.
Cash Balance Summary
The Cash Balance Summary includes the:
- Cash Balance at the start and end of the selected period and the Total Cash Movements in the period
- Realized P/L from positions closed in the period (trade P/L, costs, financing, corporate actions etc.)
- Cash Transfers and Other bookings from non-trading related bookings such as cash and security Transferred (interest, exchange subscriptions, exchange rate movements, etc.)
Cash Movements Bar Chart
The Cash Movements bar chart shows the net cash movement for each product traded, cash transfers and other booking types in the period.
P/L and Cash Movements Tools
P/L Analysis tools allows you to analyze P/L, associated costs and bookings down to the instrument level in detail. Analyze P/L by trading product, specific instruments or sectors, charting the cumulative P/L graphically or itemizing all transactions associated with product or instrument.
Profit/Loss
Profit/Loss allows you to analyze and show the cumulative Profit and Loss through trading an instrument, product or sector in a selected period.
For a selected period and account (or all accounts) you can analyze P/L by:
- Asset Type to analyze P/L by product (FX, CFD, Stocks, Futures etc.) and drill down to the instruments traded within a product
- Instrument to see the cumulative P/L development from trading a specific instrument
- Sector (where sector information is available) showing P/L by instruments traded within each sector
- Custom grouping P/L by any combination of Asset Type (product), month, year, sector, and instrument), for example, to show P/L by instrument, grouped by month traded (closed)
Cash Movements
Cash Movements allows you to analyze all bookings on your account (cash movements) associated with trading in a product or a particular instrument.
For a selected period and account (or all accounts) you can analyze bookings by:
- Asset Type to analyze bookings by product (FX, CFD, Stocks, Futures etc.) to drill-down to bookings for each the instruments traded within a product
- Instrument to see bookings for a trades in a specific instrument
- Sector (where sector information is available), showing bookings by industry. This also allow you to drill-down to the instruments traded within each sector
- Custom groupings showing bookings by any combination of Asset Type (product), month, year, sector, and instrument to show for example, bookings grouped by month traded (closed) for example
Closed Positions
For a selected period, Closed Positions shows positions that have been closed and booked on your account (or all accounts).
You can filter the Closed Positions by asset type (product) to limit the results shown.
New Portfolio Overview
The Portfolio Overview gives an overview of current net holdings on an account(s) and gives access to a historic view of the portfolio.
Allocation
The Portfolio Overview shows the following:
- exposure to each instrument and product (in the currency of the instrument)
- % allocation of the instrument of the holdings in that asset class (product)
- % allocation of the instrument of the total portfolio
Current Account Values
The Portfolio Overview also gives shows the current cash available, value of positions and account value, and shows the % days change on the account.
Historic View
You can see how your portfolio looked historically at the end of any day using the date selector showing the account values, holdings and allocations at the end of selected.
New Navigation
The new Account Section introduces horizontal navigation aligned with the rest of the GTS platform. The simplified navigation reduces the number of Account Sections and maximizes the available space for reports.
Historic Reports
Historic Reports have been reorganized into tiles giving a better overview and description of the report.
Deposit and Transfer
Transferring funds and withdrawing funds to and from your account, security transfers have also been organized into convenient tiles in the Deposit and Transfers section of the Account Section.
Other Account Functions
Trading Conditions, Subscriptions, Activity log, Contact Support Upcoming Margin and Collateral Changes, Mifid Status, Corporate action events have been moved under the Other menu and re-organized as tiles with a description of the service.


