Euro Pacific Bank

Order Driven Execution

EFFECTIVE: Nov 24 2016 – GTS Pro, at 8:00 CET, GTS (web) at 13:00 CET

In our dedicated effort to provide the best available solutions for online trading, we are implementing an Order Driven Model in GTS. This will allow greater control over trade execution through user defined “Price Tolerance.”

Sell/Buy Prices

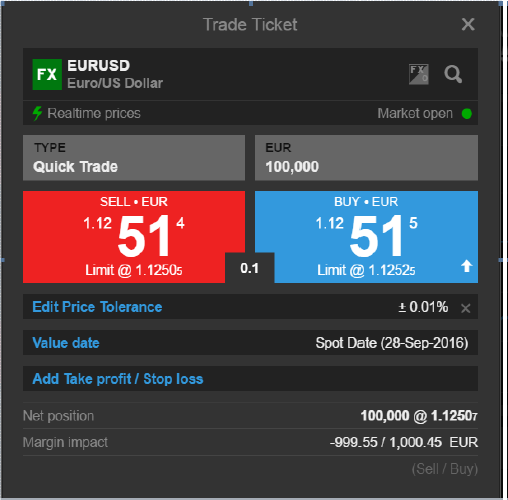
Click Buy or Sell to place a Limit Order with a pre-defined Price Tolerance.

Adding Price Tolerance ensures that your order is only executed within a range that you are comfortable accepting (see Edit Price Tolerance).

The minimum price (when selling) and maximum price (when buying) are displayed on the Trade Ticket below the Spot Price i.e. ‘Limit @ x.xxxx’

Type

Select the order type that you wish to use to enter a position:

  • Quick Trade orders for immediate execution, with or without a pre-defined Price Tolerance.
  • Resting Limit, Market and Stop orders for longer durations i.e Day Order, Good Til. Cancelled etc)

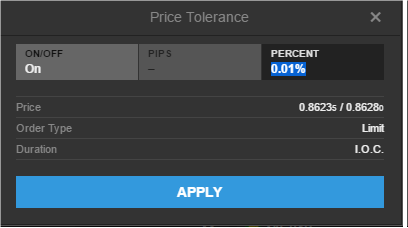
Edit Price Tolerance

Edit Price Tolerance (cross (x)-icon). Allows you to remove the option of adding Price Tolerance. This changes the Quick Trade order from a Limit Order to a Market Order.

Price tolerance enables you to define the minimum price (when selling) or maximum price (when buying) that you are comfortable accepting (i.e. a Limit Order) when entering a position.

Price tolerance can be specified in pip (i.e. 0.1 pips) or percentage terms (i.e. 0.01%).

The default is set to 0.01% of the Spot Price for all currency pairs, but is configurable on an individual currency pair level.

  • Pips: Set your tolerance in pip terms, in increments of 0.1 pip (1/10th of a pip)
  • Percent: Set your tolerance in percentage terms, in increments of 0.01 percent (1/100th of 1 percent or 1 basis point)

Futures Netting Change

EFFECTIVE: DEC 12 2016

Individual market participant, i.e. you as our partner and more importantly the dissemination of said information to your customers. 

Trading activity is being monitored and any suspicious activity will be investigated by the relevant markets and authorities.

In order to assist clients in managing futures positions in an easy and compliant manner, we are changing functionality to ensure positions are automatically netted at the end of each trading day.

Currently, if a trader holds both long and short positions in the same futures contract, in the same account, and one of the positions has a related stop loss or take profit order, these positions will not net together at the end of the trading day. It is possible to be long and short in the same futures contract, which is non-compliant. Please refer to the recent communication regarding Market Conduct Rules for more information.

From 12 December, 2016, positions will be automatically netted using FIFO, regardless of related orders.

For example if a trader is:

  • Long +3 Light Sweet Crude (WTI) + stop loss
  • Short -2 Light Sweet Crude (WTI)

These will be netted to:

  • Long +1 Light Sweet Crude + stop loss

Note that the stop loss will still be for 3 contracts and will not be adjusted.

Changes to margin requirements for Futures as of Nov 23 2016

EFFECTIVE: Wednesday, 23 November 2016 at 1:00PM GMT

Exchanges have revised the margin requirements as per below web links:

The margin requirements for the following contracts will be changed on Wednesday, 23 November 2016 at 1:00PM GMT.

If you require details of the assumed impact of the change for Futures do not hesitate to contact the Bank.

Base Contract Base Name Exchange Curr Initial Margin Maint. Margin New Initial Margin New Maint. Margin Change Pct
BAX 3 Month Bankers’ Acceptance Bourse de Montreal Inc. CAD 430 430 470 470 9.07%
GE 3 Month Eurodollar Chicago Mercantile Exchange USD 580 530 670 610 14.15%
HG Copper Commodity Exchange (COMEX) USD 2530 2300 3030 2750 19.57%
SI Silver Commodity Exchange (COMEX) USD 6380 5800 7150 6500 12.07%
OMX OMX Index NASDAQ OMX Stockholm SEK 11980 11980 12140 12140 1.32%
HRC Hot-Rolled Steel Index New York Mercantile Exchange USD 470 430 570 510 18.60%
PA Palladium New York Mercantile Exchange USD 5480 5480 5840 5840 6.57%
OBX OBX Index Oslo Børs/Oslo Stock Exchange NOK 5670 5670 5740 5740 1.22%
PH MSCI Philippines Index Singapore Exchange Derivatives Trading Ltd. USD 1190 1190 1210 1210 1.68%
SCO Iron Ore CFR China (62% Fe Fines) Singapore Exchange Derivatives Trading Ltd. USD 770 700 880 800 14.29%
SSI Nikkei 225 Singapore Exchange Derivatives Trading Ltd. JPY 418000 380000 473000 430000 13.16%

November 2016 New Products & Platform Updates

Product Updates

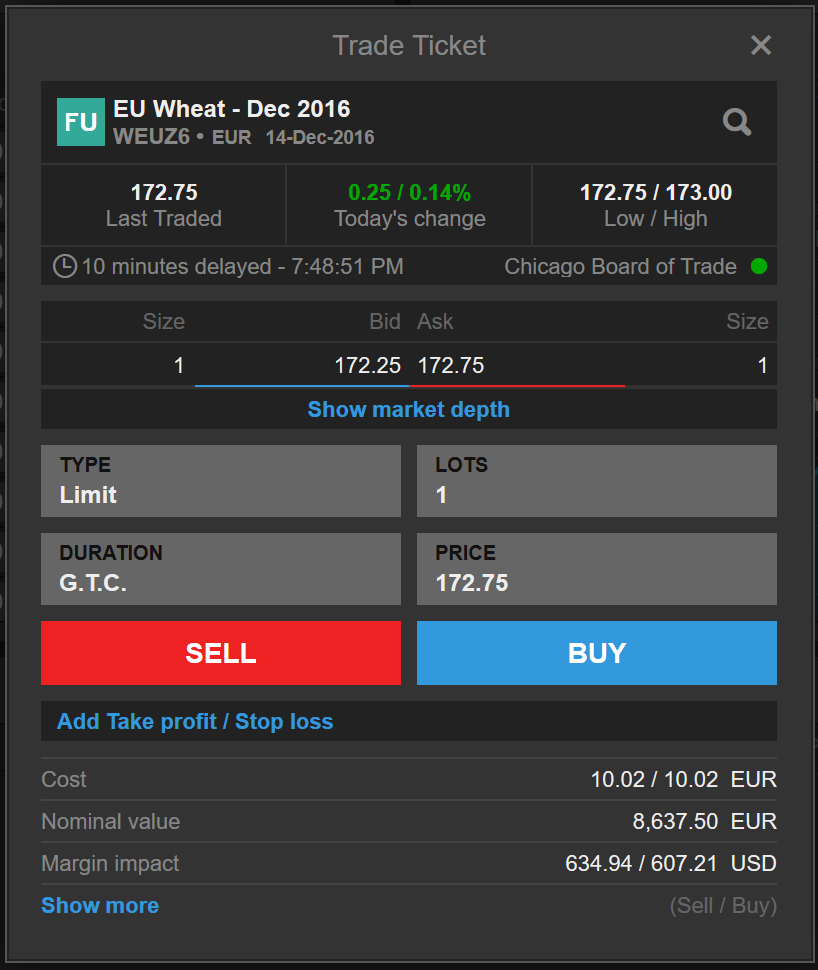
European Wheat Futures contract from CME now available

EU Wheat Futures contracts (WEU) from CME are now tradable through the trading platforms.

Weekly Equity Index Options on Futures

The CME Group is now offering Weekly Equity Index Options on futures at a lower cost than standard option expiries. This allows an alternative to quarterly offerings with lower cost premiums. We have added the E-mini S&P 500 weekly options, along with a Wednesday expiry option in GTS. We will be looking to add more offerings to the platform in the near future.

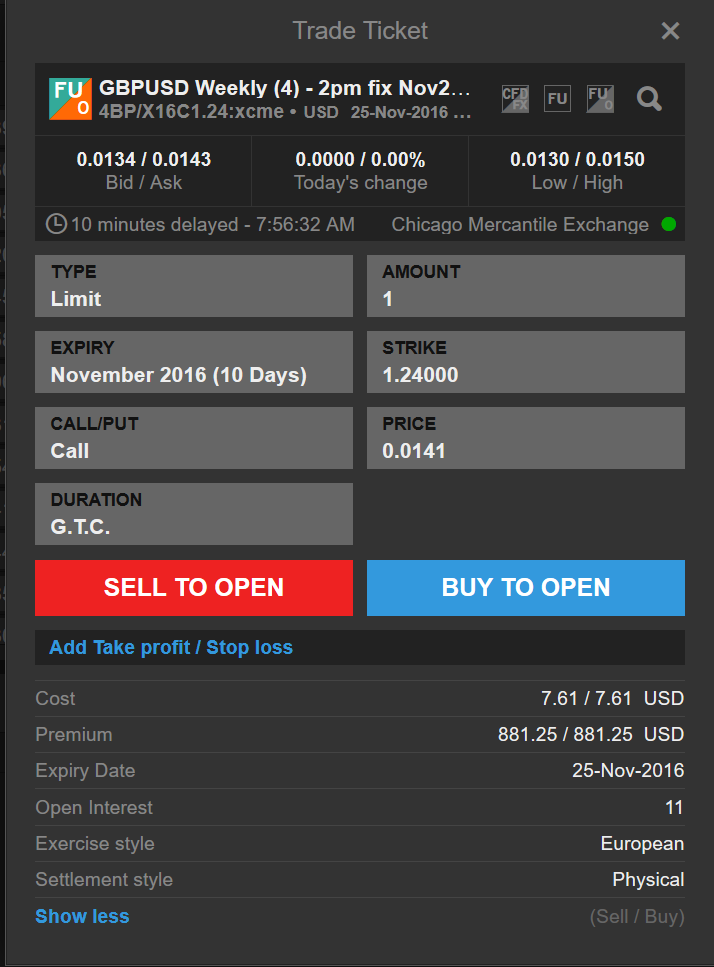
G6 FX Futures Options converting to European-style options

CME is moving from American-style to European-style on G6 FX Futures options. Weekly options and monthly options with expiries in 2017 are now traded as European-style options.

  • Six major premium-quoted European-style FX Futures options will replace American-style premium-quoted options
  • American-style FX options currently listed on these six major FX will expire at their currently scheduled expiries
  • Any new monthly listings will be listed as European-style options
  • European-style weekly, monthly and quarterly options on AUD/USD, GBP/USD, CAD/USD, EUR/USD, JPY/USD and CHF/USD will exercise into the nearest quarterly Futures contract

Platform Enhancements

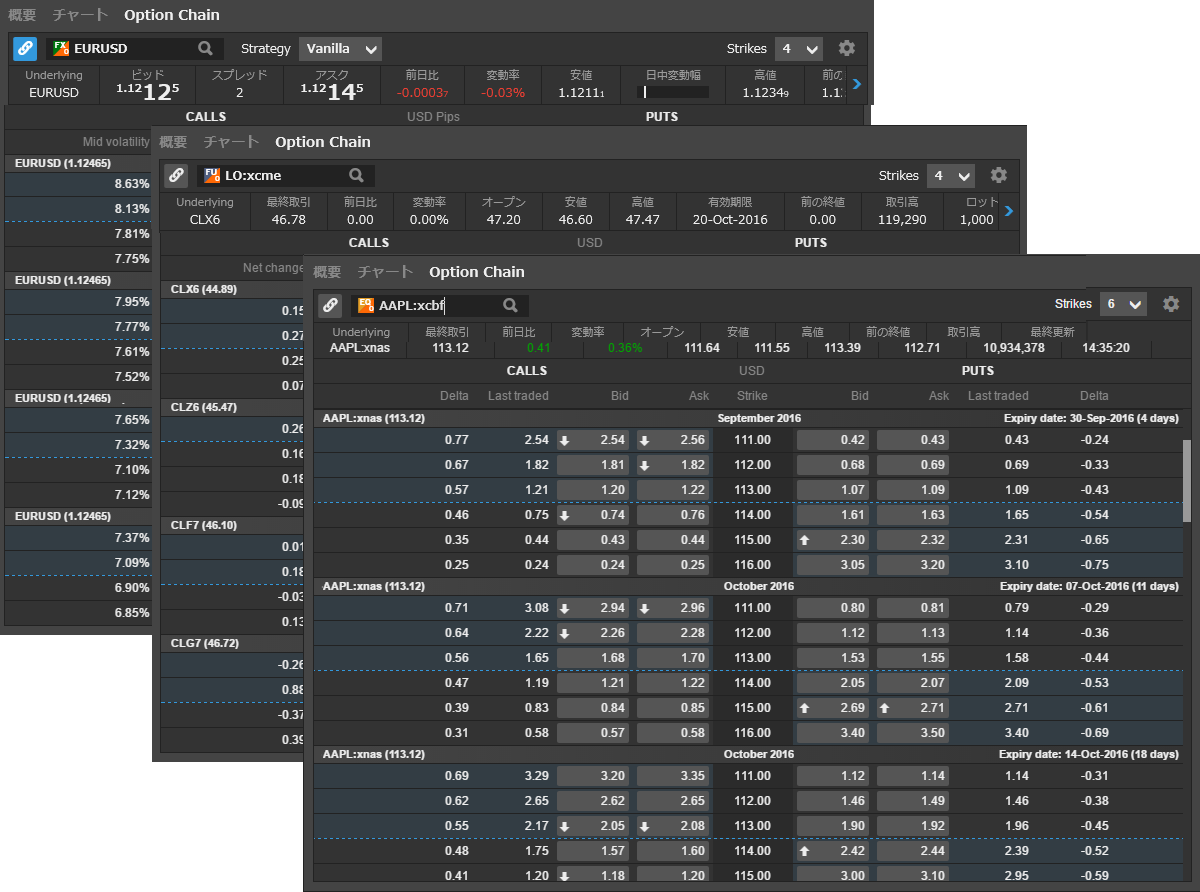
Options Chain Now Available

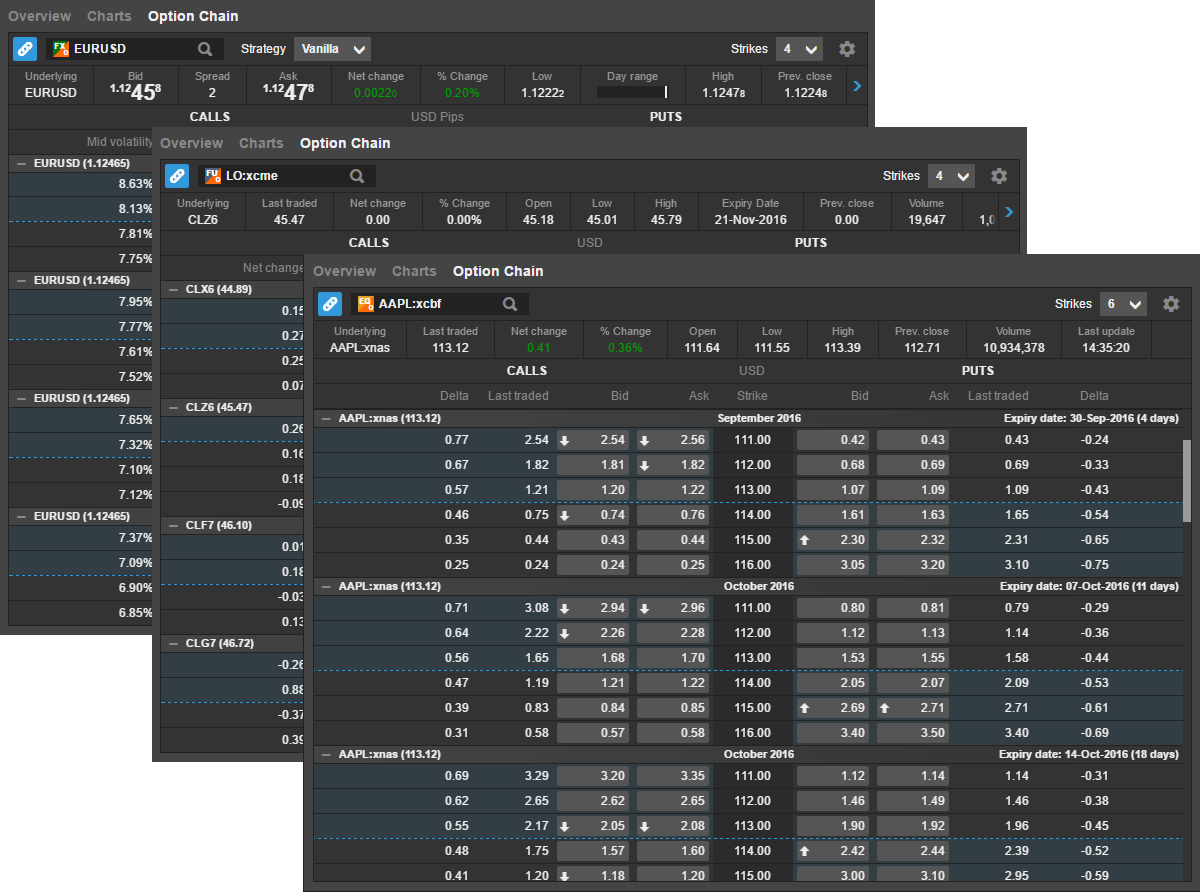
The new Option Chain allows trading of FX Options and Exchange Traded Options on stocks, indices and futures.

Features of the new Option Chain include:

  • Option Chain can be linked to the Watchlist, allowing fast switching between instruments from the Watchlist
  • FX Vanilla and FX Touch Options
  • In-the-money highlighting of strikes
  • Shows the underlying instrument price information
  • Customizable number of strikes shown for each expiry
  • Customizable columns, including Greeks and volatilities for US stock options

New Chart Features

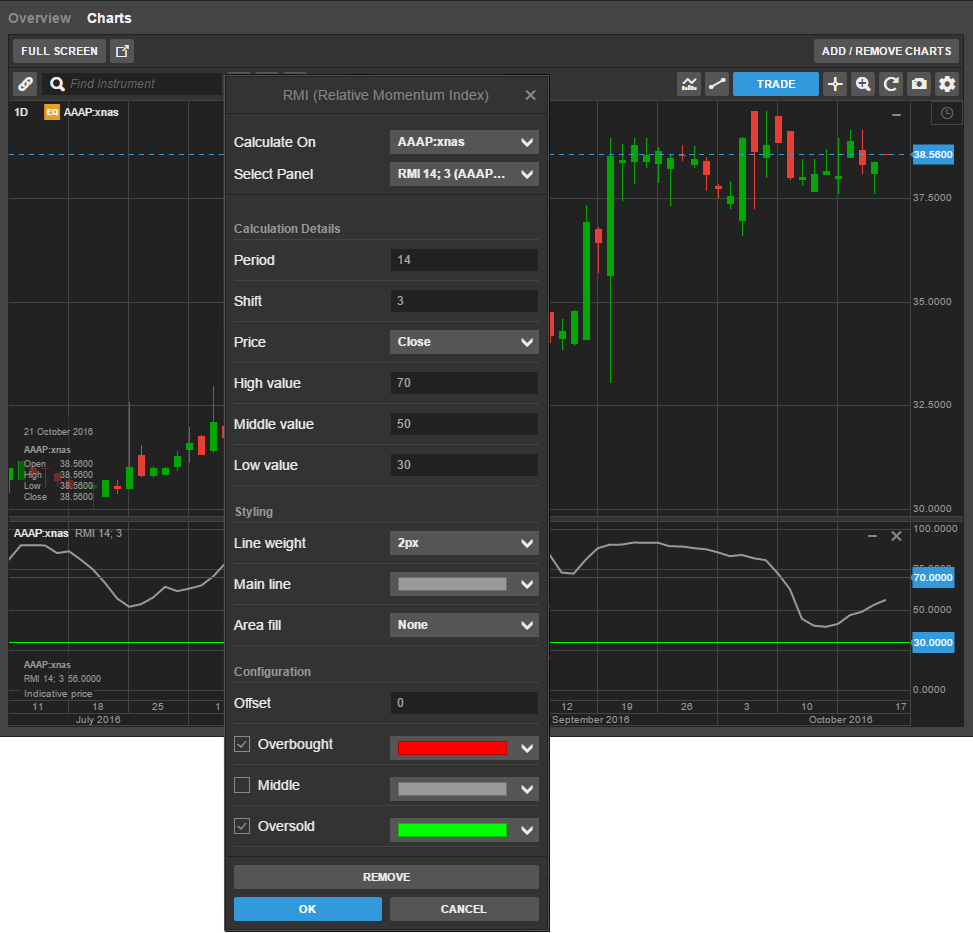
New technical indicator – Relative Momentum Index

Developed by Roger Altman, the Relative Momentum Index (RMI) is a variation of the Relative Strength Index (RSI), but where RSI counts days using closing prices only, RMI counts from todays close relative to the close n days ago.

The RMI smooths volatility more than the RSI, and the longer the time intervals the smoother the RMI line.

Similar to the RSI, the RMI has a range of 0 to 100, with values typically of between 30 and 70. Values above 70 can indicate overbought conditions, while values below 30 can indicate oversold conditions.

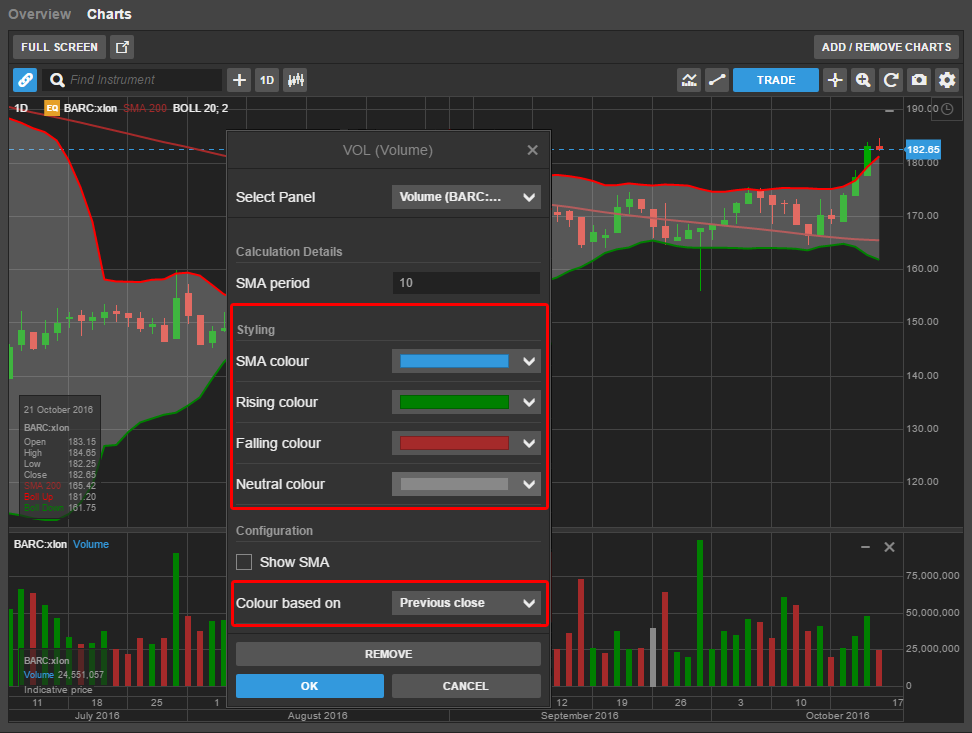
New technical indicator – Closed Colour Volume (CCV) on Volume indicator

Closed Colour Volume (CCV) is now available on Volume (VOL) studies which colours Volume bars according to whether the price closes up or down in the period. By default, up day volumes are green, down day volumes are red, and no change volumes are grey. You can customize these in the settings for the study.

The ìColour based on option allows you to select whether the volume is coloured based on between Previous close or Current open.

Annotations – Vertical line date/time label

A label annotation is now available in the settings of the Vertical line annotation which displays the date and time on the x-axis.

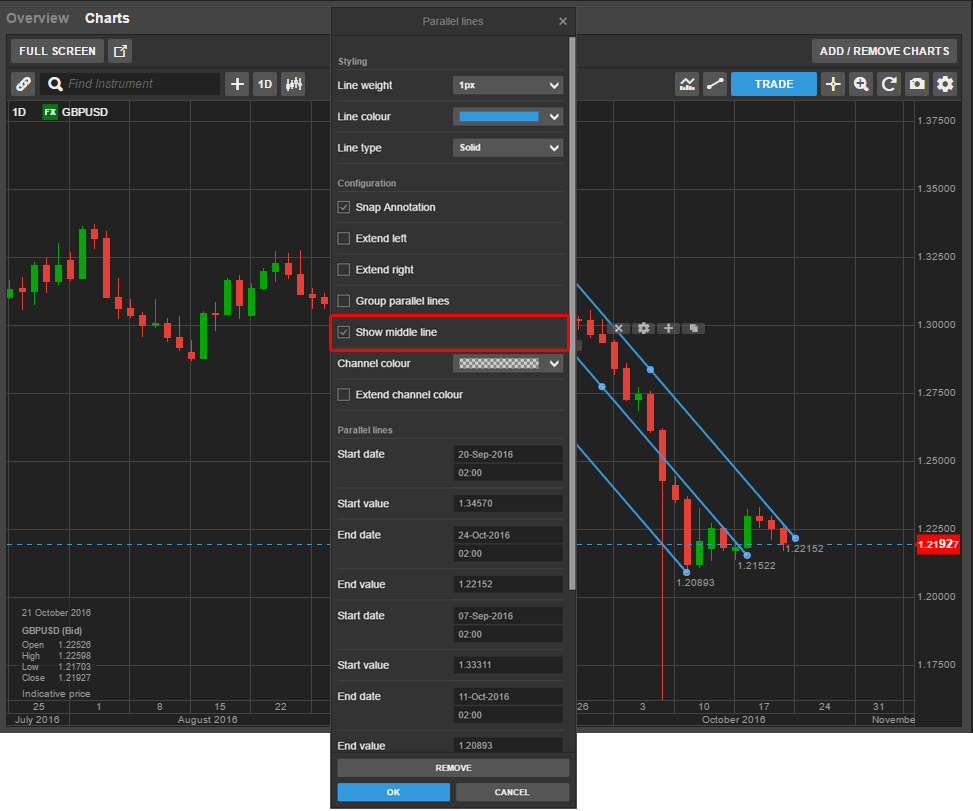
Annotations – Add mid-line on Parallel lines

A middle line can now be added to the Parallel lines annotation by checking the ìShow middle line checkbox. The area between the two parallel lines can also be coloured now by selecting the Channel colour option.

Changes to trading from the Watchlist

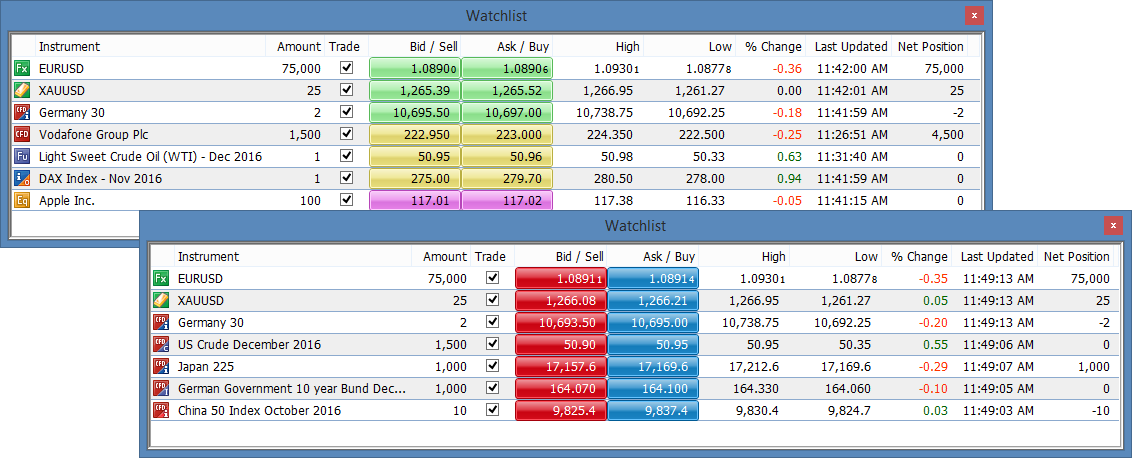
When subscribed to live prices for an instrument, the Watchlist, now directly places a market order when clicking the Bid/Ask button for Stocks, Stock CFDs, Futures and ETOs.

For instruments on delayed prices, the Watchlist will continue to launch a Trade Ticket.

Temporary Margin Changes for Upcoming US Election

PUBLISHED: OCT 25th 2016

  UPDATE: NOV 10th 2016

With the immediate market risk of the US election behind us, margin levels have now been normalised. The margin rates for your margin profile can be found under Account -> Trading Conditions in the platform.


  UPDATE: NOV 9th 2016

Following the uncertainty posed by the US election, Global Trading is continuing to assess market conditions and is currently aiming to return to normalised margin levels starting tomorrow at 12:00 GMT, if no further unexpected developments occur. You will receive final details of the rates and final confirmation of the timing tomorrow, 10 November, 2016, around 10:00 GMT.


In anticipation of potential volatility during the upcoming US election period, we will be raising margins for a selected group of products as of Thursday, November 3rd, 2016 at 13:00 GMT. This will help protect against potential volatility, rapid price movements, and gapping. Due to market uncertainty in the lead-up to this event, please be aware of the possibility of substantial price gaps and illiquidity, along with rapid price movements in certain stocks, indices and FX pairs.

Similar margin changes were implemented leading up to the UK referendum (Brexit), in June.

Please bear the following in mind when trading during periods of potential market volatility:

  • Market liquidity may vary substantially, and trade/quote requests may be unavailable at times as existing resting orders and new market orders are filled as priority
  • Market orders are not guaranteed to be filled at any specific price – they will be filled “at best” according to available market price when processed
  • Stop Loss orders are converted to Market orders once triggered, so are not guaranteed to be filled at your stop order level – gaps in available liquidity can result in significant slippage on Stop orders
  • Buying options (i.e. puts to protect long positions and calls to protect short positions) could be a hedging vehicle suitable for market uncertainty such as the US Election since the Strike price is fixed in advance
  • Ensure that you are familiar with placing orders and initiating trade requests on the platform
  • Consider placing relevant resting orders well in advance of the US election

For GTS clients, please go to “Margin and Collateral Changes” under the “Account” tab in the GTS web-browser to view further details on specific margin & collateral changes along with future updates. Current requirements can be found under “Trading Conditions.”

It is important to note that additional requirements may follow, and we will notify clients as soon as possible. If you have any open positions in the affected markets, we advise that you monitor your positions accordingly to ensure a sufficient account surplus and margin collateral. The above changes should be temporary, however, and we expect a return to normal levels depending on market conditions following the US election.

October 2016 New Products & Platform Updates

Platform Enhancements

Upcoming Product Additions


Platform Enhancements

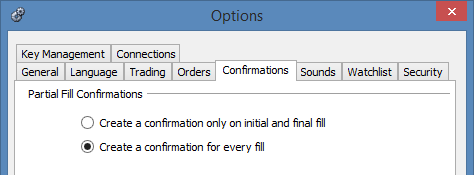
​​Partial Fill Confirmations

From 11 October, it will be possible to configure how GTS delivers trade/order confirmations on partial fills. Users can now choose to receive confirmations for each partial fill or only for the first and last partial fill under Options & Confirmations.


Trade Tile Behaviour in 2-Click Trading Mode

In 2-click mode, a trade is enabled by clicking ‘Enable’ which then enables buttons to trade the instruments. From 11 October, the time from clicking ‘Enable’ until the trade buttons are clickable will be reduced from 1.5 seconds to 0.5 seconds.

Improved Usability in 2-Click Trading Mode

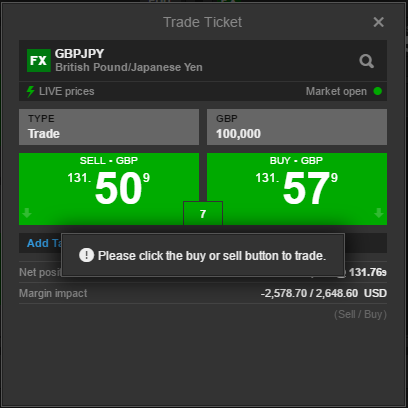
In 2-click trading mode after clicking to enable a trade, we have added a message reminding traders to click again to perform the trade.


New Close Position Module and Improvements

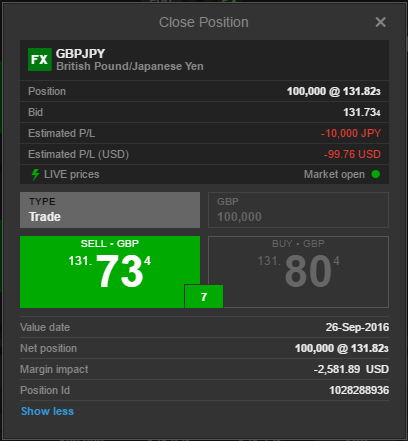
When closing a position directly from the Position List, a new unified Close Position module will be available in GTS, based on the Trade Ticket.

Important information, including the amount, current price, and profit/loss, is located at the top of the Close Position ticket. Secondary information, including the Net position size, the Margin impact and Position ID, are located in a secondary collapsible info panel at the bottom.

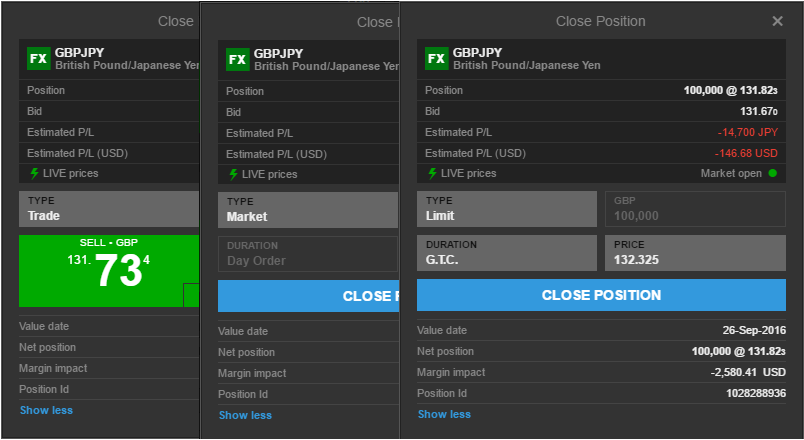
Traders can also choose to close positions:

  • On a quoted price for FX and CFD trades
  • Using a limit order to close at a specific price
  • Using a market order to close at the price available in the market

New Dedicated Close Button in Positions

To improve usability, a new dedicated Close position button will be introduced in a separate column. Previously, positions could be closed by clicking on a button in the Close Price column:


Reduce Exposure from the Square Net Ticket

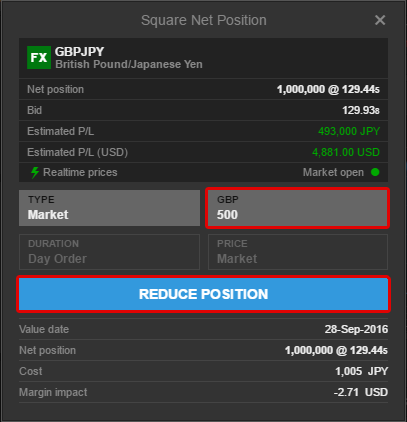
It will be possible to reduce, as well as close, Net positions from the Position List in GTS. When clicking the Close button on a Net position, the Square Net Position dialog will allow traders to specify the amount they want to close – the action button changes to REDUCE POSITION.


Upcoming Product Additions

Rolling out a Fully Digitized Bond Value Chain

​We are proud to announce a paradigm shift in the way bonds are being traded by launching the first fully digital solution for trading bonds online, on October 24th.

You will be able to access the global bond markets in a direct, competitive and efficient manner, and benefit from:

  • A fully digitalised value chain
  • Price optimisation from global liquidity providers to reduce spreads
  • Significant cost reductions
  • Fast execution within seconds (24/5 when markets are open)
  • Corporate and government bonds from all major global markets

​​Launching Option Chain in GTS

We are pleased to announce that we are launching an Option chain on the GTS platform. The new Option chain will allow trading of FX Options and Exchange Traded Options on stocks, indices and futures.

Option Chain Features

Features of the new Option chain will include:

  • Option chain can be linked to the Watchlist, allowing fast switching between instruments from the Watchlist
  • FX Vanilla and FX Touch Options
  • In-the-money highlighting of strikes
  • Shows the underlying instrument price information
  • Collapsable strikes
  • Customizable number of strikes shown for each expiry
  • Customizable columns, including Greeks and volatilities for US stock options

Initially, the Option chain will be available in GTS Pro, and later with the GTS web-based platform.

Value of Option Positions to be itemised separately in Account Overview

To improve breakdown of the Account Value across cash, margin and Option positions, the value of Option positions will be itemised separately in Account Overview.

Today, the value of FX Options is included under P/L, Margin Positions and the value of Exchange Traded Options is included under Market value, Cash Positions in the Account data in GTS and GTS Pro.

To improve the breakdown and consistency of Account Summaries, a new dedicated Market Value, Option Positions field will be added and the values of FX and Exchange Traded Options moved to this new field.

More detailed information will follow in next month’s notification.

September 2016 New Products & Platform Updates

Chart Updates

New Studies

Trade all Instruments from Trade Board

Trade Panel Removed


Chart Updates

New Display Options

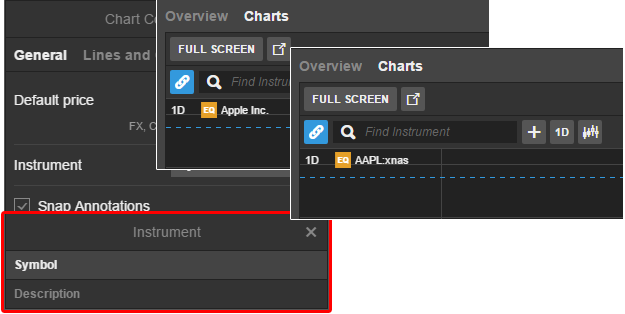
Instrument Symbol/Description

A new option allows you to display instrument names as a symbol (ticker) or description:
Price Label

The last price indicates whether it is an uptick or downtick by red or green background colouring; a blue colouring indicates no price activity for 3 seconds.


The price for FX charts also emphasizes the pips in alignment with the rest of the platform.

Fill colours for candlesticks and studies

We have added new colour options where you can define the line, border and fill colours for candlestick charts and studies such as Bollinger Banks.

You can also configure hollow candlesticks by selecting no colour.
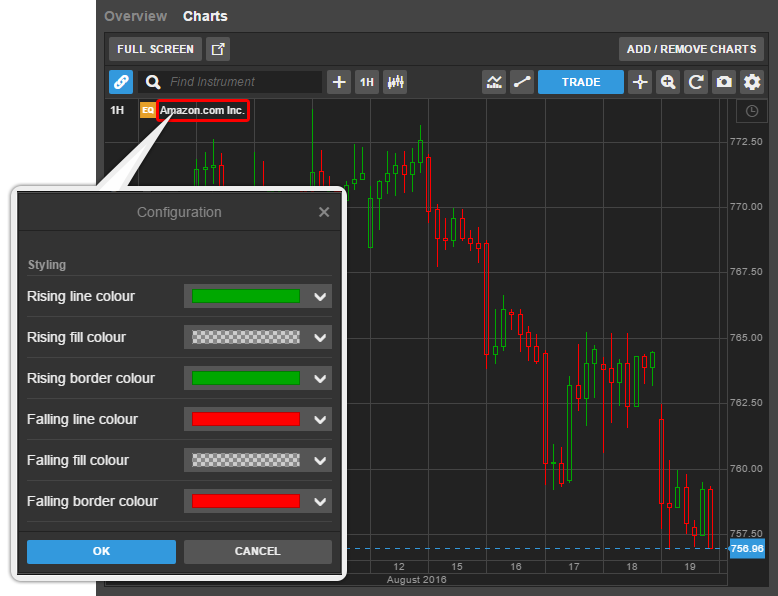
Similarly, for studies such as Bollinger bands, you will be able to define or remove the fill colour between the bands.

Fibonacci adjustment to the right

The length of the lines on Fibonacci Annotations can now be adjusted left/right. Select the Fibonacci you want to adjust and grab the handle and drag the lines left or right.
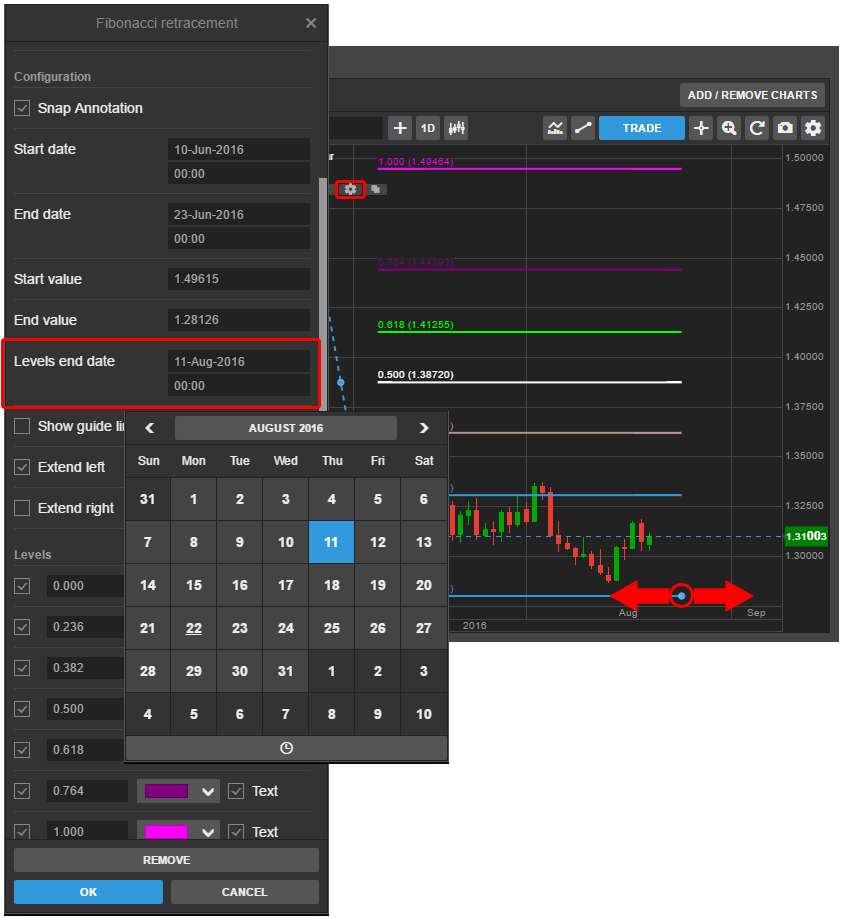
In the Settings for the annotation, you can adjust the end time and date or extend them infinitely.

Vertical line extension

It is now possible to extend vertical line annotations through to sub-panels by clicking on the configuration icon and selecting Extend vertical line.

Copy Annotations

You can now copy annotations by clicking the copy icon on the annotation.

Individual snapping

Now you can also select or deselect snapping in each individual annotation in the specific annotation configuration settings.

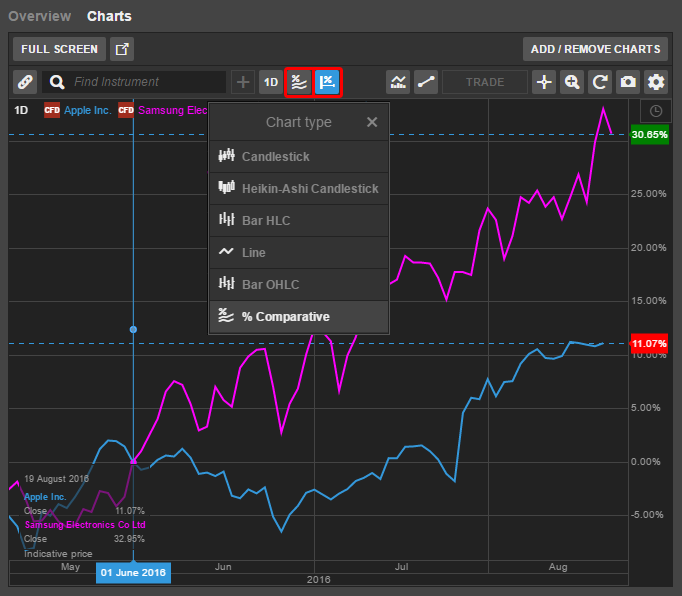
Percentage Comparative Chart

A new % Comparative chart type is now available allowing you to compare the relative performance of two instruments.

​To use the Comparative chart, add the second instrument, click the + button next to the instrument finder, then search for the second instrument, then select % Comparative as the Chart type.

The % Comparative chart shows values relative to the reference point bar. You can drag the reference bar to move the reference point on the x-axis. To use the left of the chart as the reference point, deselect the ruler on the toolbar – note that if you zoom, scroll or manipulate the x-axis, the reference point will change to the new left-hand side of the chart.

New Studies

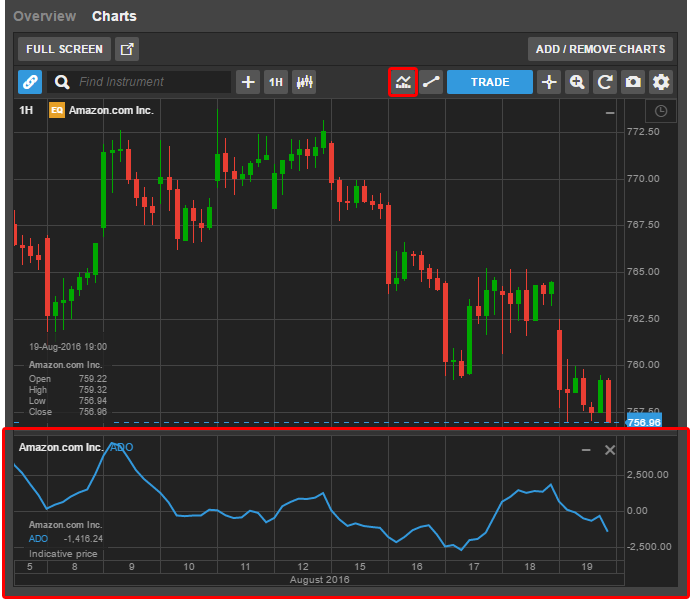
(Chaikin) Accumulation Distribution Oscillator

Chaikin Accumulation Distribution Oscillator (ADO) is a momentum indicator which is similar to the previously released Chaikin Accumulation Distribution Line (ADL) but using the exponential moving average formulas used by MACD.

ADO is essentially the difference between 3 and 10 periods Exponential Moving Averages. For example, for a daily chart it would be the difference between the EMAs for 3 days and 10 days.

ADO is used to detect directional changes in ADL by measuring the momentum of the movements – the first signal for a change of a trend. ADO generates a signal when the line crosses below or above the zero line.

ADO can also indicate bearish or bullish divergence:

  • If the price is rising and AD is falling (negative divergence) can indicate a bearish market
  • If the price is falling and AD is rising (positive divergence) can indicate a bullish market

Williams Alligator Indicator

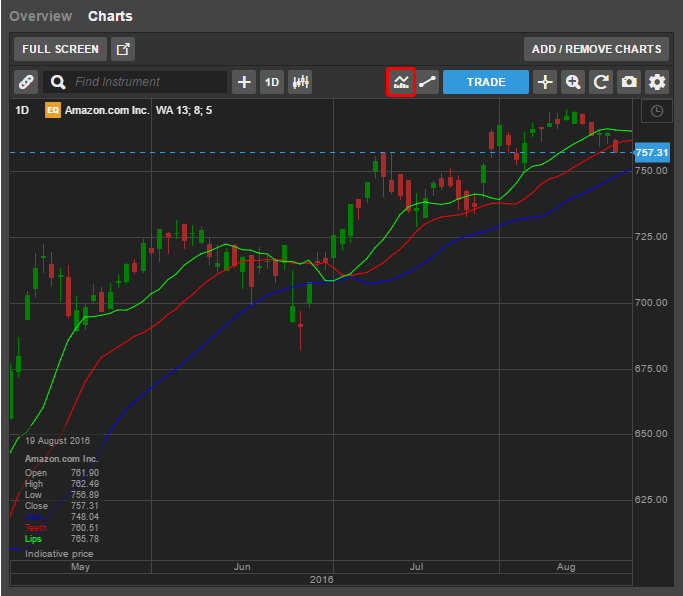
Developed by Bill Williams, the Alligator Indicator is a trend following and trend change indicator. It uses three different Smoothed Simple Moving Averages (SSMAs) which slow the turn of the indicator and uses 5, 8 and 13 periods as default – you can change the calculation method from SSMA to SMA (Simple Moving Average) or EMA (Exponential Moving Average) in the configuration dialog.

The three Smoothed Moving Averages comprise the Jaw, Teeth and Lips of the Alligator where:

  • Jaw (blue line) – starts with the 13-bar/candle SSMA and is smoothed by 8 bars/candles on subsequent values
  • Teeth (red line) – starts with the 8-bar/candle SSMA and is smoothed by 5 bars/candles on subsequent values
  • Lips (green line) – starts with the 5-bar/candle SSMA and smoothed by three bars/candles on subsequent values

The Alligator Indicator helps you to determine trends and trend changes and direction of the trend where:

  • Uptrend: Jaw at bottom, Teeth in the middle, Lips at the top
  • Downtrend: Jaw at top, Teeth in the middle, Lips at the bottom

When the above rules are not in place – when the lines are not in any of the above orders and intertwined – the Alligator “sleeps” with its mouth closed. When it wakes up and is hungry, it opens its mouth in the correct order above, and that is when a trend starts. When the Alligator is no longer hungry and the three lines intertwine again, that signals the end of a trend.

Using the Alligator Indicator, you should not take a position when the Alligator is sleeping as the market is indecisive without a clear trend.
Awesome Oscillator

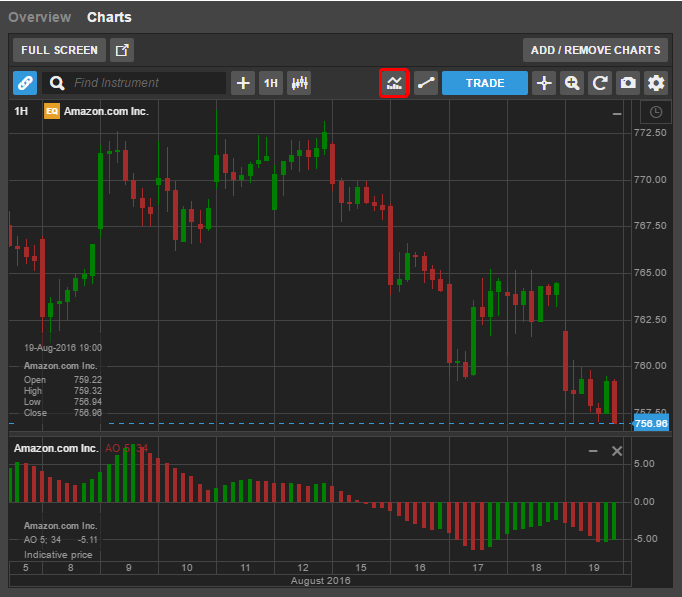
Awesome Oscillator (AO) was developed by Avrum Suodack and Gene Quong. It uses both volume and price to measure buying and selling pressure in an instrument. The output values ranges from 0 to 100 and works like an RSI – the Awesome Oscillator is also known as volume-weighted RSI.

Investors use the Awesome Oscillator to look for divergence when the MFI moves in the opposite direction of the price.

Correlation

Now you can analyze the correlation between two instruments using the Correlation study in the Indicator selector and add it when you have two instruments.

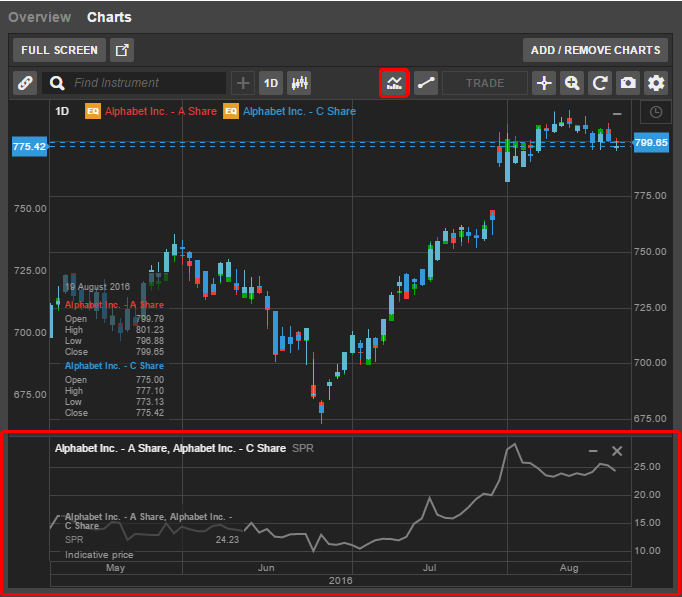
Spread

The Spread study is used with comparable instruments that are trading with a spread between them such as:

  • A and B share for the same company
  • 2 equities in the same industry sector
  • 2 commodities futures

The spread can widen and narrow and can be used for Spread Trading where the trader sells one instrument and buys the other when the spread is wider than historical norms for example.

Ratio

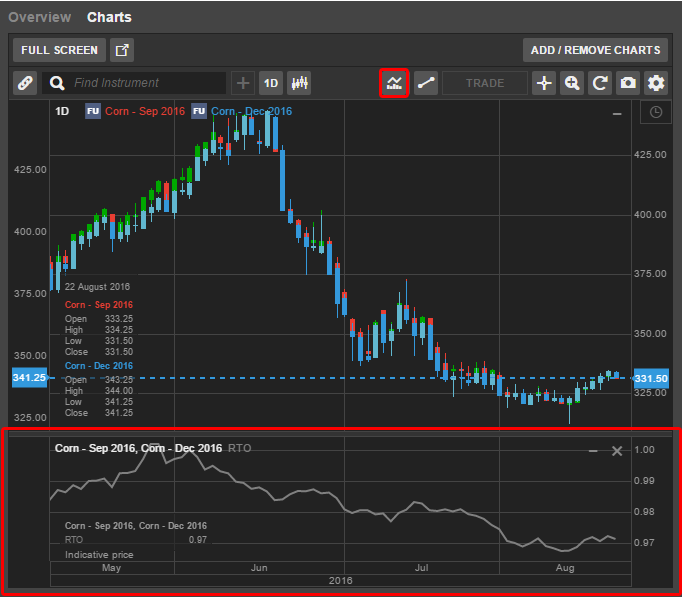
The Ratio (RTO) Indicator shows the current and the historic price ratio between two instruments. Ratio is similar to the spread but shows the price difference as a ratio between the two instruments – the first divided by the second.

Trade all Instruments from Trade Board

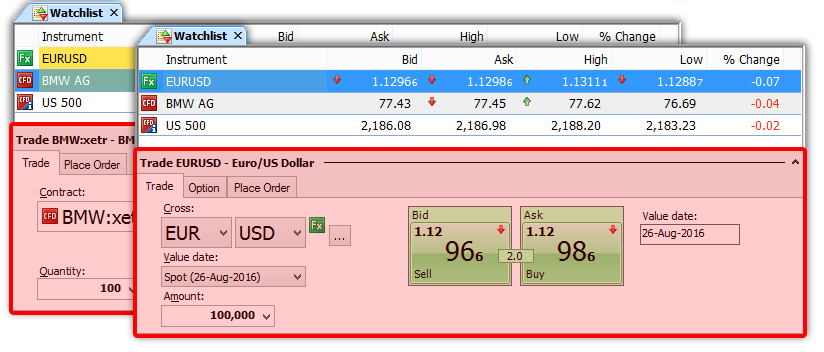
Stocks, CFDs and Futures through the Trade Board

SaxoTrader now allows you to trade exchange-traded instruments through the Trade Board, including Stocks, CFDs (all CFDs), Futures and ETOs. Previously, only instruments FX and CFD indices (on green prices) were tradable through the Trade Board.

To trade an instrument from the Trade Board, you must be subscribed to live prices for the instrument from the exchange – instruments on delayed prices cannot be traded through the Trade Board and the trade buttons will launch a Trade Ticket instead.

Trading as Market Orders

If you do not specify a tolerance for the instrument, the trade buttons will place a Market order for the instrument, to be filled at the price available on the Market.

Trading as Limit Orders

If you specify a price tolerance, the trade buttons will place a limit order instead, ensuring you are not filled at more than your price tolerance from the market price.

Access to the Trade Board

The Trade Board is part of the Watchlist and is accessed by clicking the Trade Board icon in the Watchlist.


Trade Panel Removed

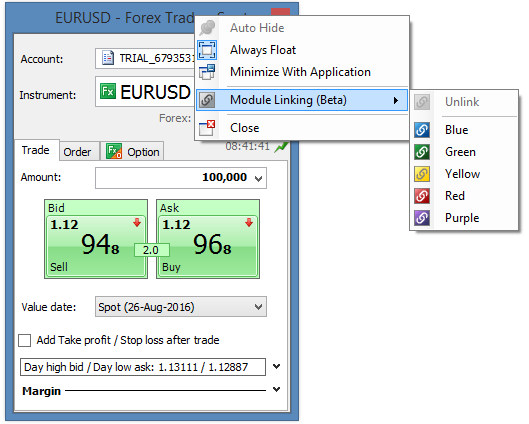
As part of a usability clean-up, the Trade Panel at the bottom of the Watchlist has been retired due to low usage.
If you miss this functionality, we recommend that you open a Trade Ticket in you view and link it to your Watchlist – the instrument in the Trade Ticket will update with selected instruments in the Watchlist in the same way as the Trade Panel.
August 2016 New Products & Platform Updates

Product Updates

Operational and margin changes


Product Updates

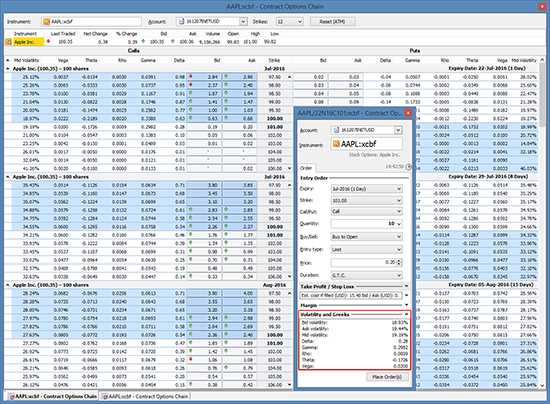
Greeks and implied volatility on US stock options now available

Greeks and Implied Volatility are now available on US stock options in the GTS Pro platform in the Option Chain and Trade Tickets.

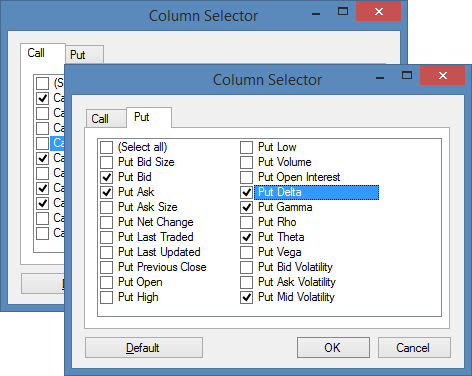
To add Greeks and Implied Volatility to the Option Chain:
Right click on the table header, select Column Selector, then add the Greeks/Volatility columns in the Call and Put tabs.

Operational and margin changes

New equity rating model

In a string of improvements within the area of Market Risk Management, Global Trading will now introduce a new model for equity rating.

The model

The new equity rating model provides continuous daily assessment (and potential re-ratings) for up to 11,000 unique shares. The model is relatively simple and straightforward, building on the following factors:

  • Market Capitalisation (Large, Mid or Small)
  • Volatility (Low, Moderate, High or Extreme)
  • Credit Rating (Excellent, Good, Regular or Poor)
  • Gap tendency (Negligible, Marginal, Critical or Catastrophic)
  • Liquidity (High, Medium or Low)

In order to transition to this new model, Global Trading will make two overall changes:

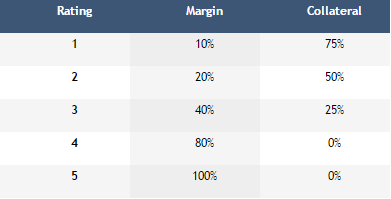
1) Limit the number of “risk buckets” to five

2) Re-rate all instruments to suit the new limited number of risk buckets

Global Trading’s new standard will be as follows:

Next steps:

Please observe the below deadlines and roll-out dates:

  • The re-rating will be taking effect as of 12 September, 2016.

July 2016 New Products & Platform Updates

Product Updates

Platform Enhancements


Product Updates

News Offering Update

Termination of Dow Jones news feed

As of July 2016, the Dow Jones news feed will be removed from the GTS platform.

Introducing NewsEdge

NewsEdge is a new offering on GTS that gathers news from numerous providers.

In addition to Macro and Corporate coverage, which is available in the platform immediately, NewsEdge also provides product-specific news feeds.

All subscriptions are free and the offering includes:

  • NewsEdge Macro
  • NewsEdge Corporate
  • NewsEdge Forex
  • NewsEdge Commodities
  • NewsEdge Futures
  • NewsEdge Bonds
  • NewsEdge Central Banks
  • 11 regional news streams with local coverage in local languages

Find subscriptions in the trading platform under Account > Subscriptions > News services.


Ruble (RUB) Options & Forwards and Extension of Trading Times

FX Options and Forwards are now available for USDRUB and EURRUB on live (green) prices.

Trading in RUB FX crosses has also been extended from 16.00 GMT to 19.00 GMT.


Platform Enhancements

New Chart Features

Accumulation Distribution Line (ADL) Study

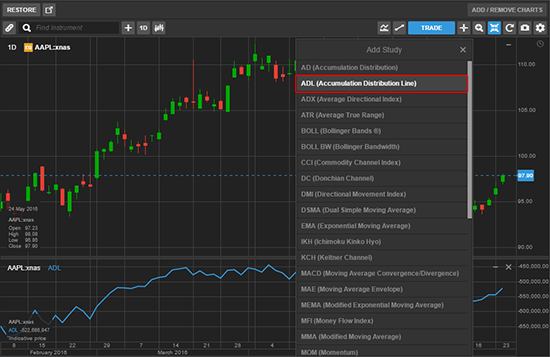
The Accumulation Distribution Line (ADL) developed by Marc Chaikin is now available from the Studies menu.

Chaikin ADL is a volume-based indicator designed to measure the cumulative flow of money into and out of a security, essentially measuring the buy and sell pressure and confirming the strength of a trend.

The ADL indicates both bullish and bearish signals and relies on divergence and confirmation:

  • a bullish signal is when the price is in a downtrend and the ADL is moving up.
  • A bearish signal is when the price is in an uptrend and the ADL is moving down.

This study relies on trade volume so it is only available on exchange-traded products and is not available on OTC products such as FX.


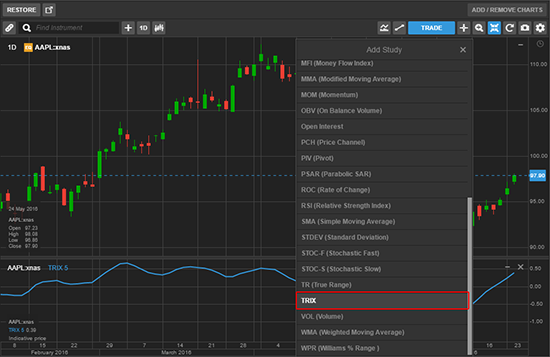
Triple Exponentially Smoothed Moving Average (TRIX) Study

Triple Exponentially Smoothed Moving Average (TRIX) is a momentum oscillator developed by Jack Hutson and shows the % change in a triple-exponentially-smoothed moving average. It filters out insignificant prices and if you add a normal exponentially moving average to the TRIX study panel it works in a similar way to MACD. However, since it is triple-smoothed it is more smoothed than MACD.

Similarly to MACD, the lines fluctuate around 0 (zero) and when adding an EMA you look for divergence where the signal line crosses over for buy/sell and zero crossover line.


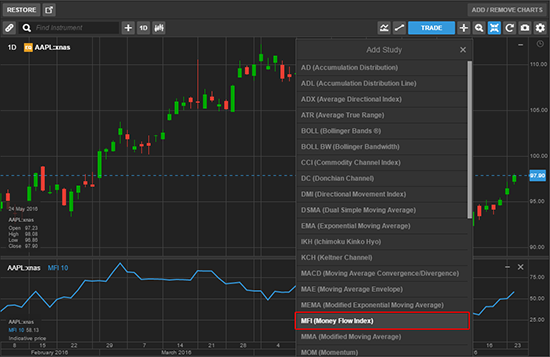
Money Flow Index (MFI) Study

Money Flow Index (MFI) is an oscillatior developed by Avrum Suodack and Gene Quong, which uses both volume and price to measure buy and sell pressure on a security. The output value ranges from 0 to 100 and works like an RSI – MFI is also known as volume-weighted RSI.

Investors are looking for divergence – when the MFI moves in the opposite direction of the price.


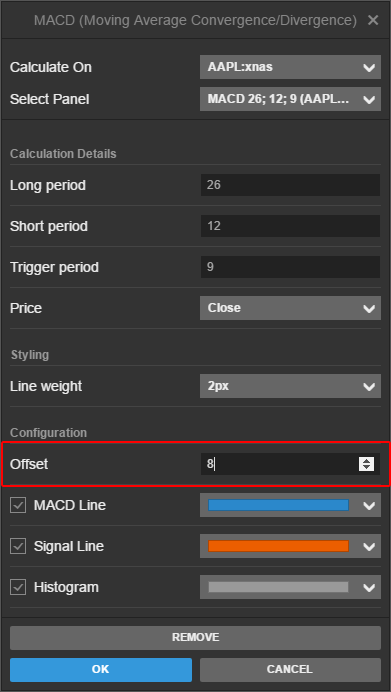
Study Offsets

A new Offset feature is now available from the configuration dialog for studies where you can move a study left into the past or right into the future by up to -100 to 100 periods. The underlying calculation does not change this feature, only moves the study left or right on the chart.


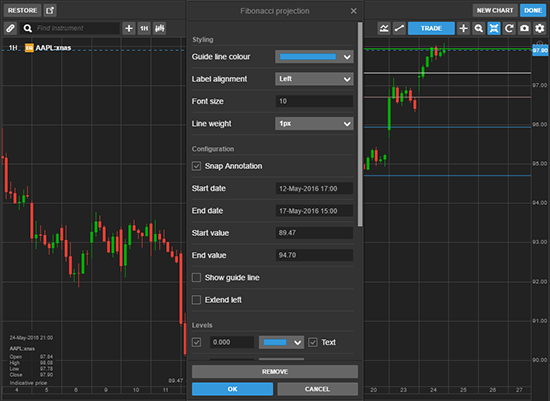
Fibonacci Projection annotation

A new Fibonacci Projection annotation is now available from the annotation menu in the chart.

Previously this was available through the Fibonacci Extension annotation by placing the two last placements at the same level, but it can now be added more efficiently in two clicks.


Snap Annotation option

Previously, snap for annotation was only available in the configuration settings, controlling snap on all annotations. You can now also select / de-select snap on each individual annotation in the annotation configuration settings.


New Periodic Overview Report

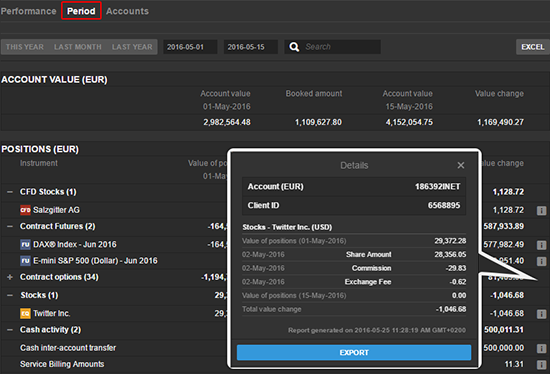
Now available on GTS, the new Period Overview report shows account value development itemized as profit and loss per traded instrument and cash bookings, and allows analysis of broader, long-term trading trends.

The Period Overview report will be available in the Account section of the GTS platform and will show the development of a selected account or across all accounts.

The info icon (i) on each post gives access to full details of the post including:

  • the value of the position at the start and end of the period
  • a summary of all individual bookings for the instrument throughout the period

Excel Export

The extended Excel function allows you to export each booking in the period showing the value at the start and end of the period and offers granularity and flexibility of the data.

The report can also be exported as PDF.


New Exposure Bar and Value Change Charts

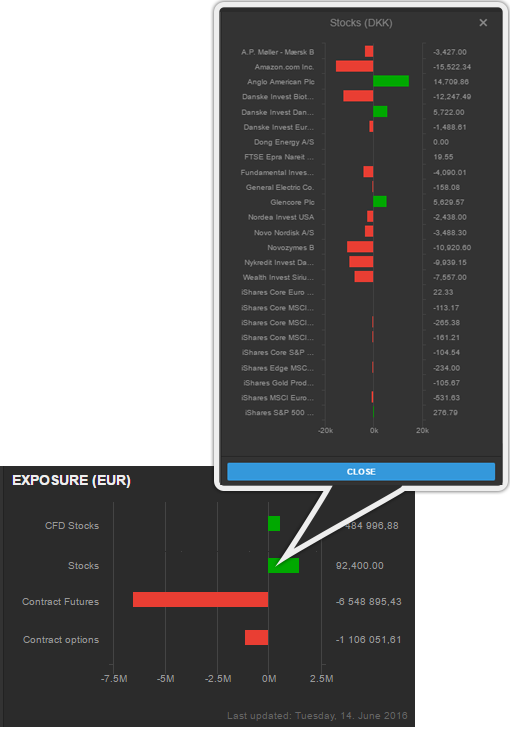
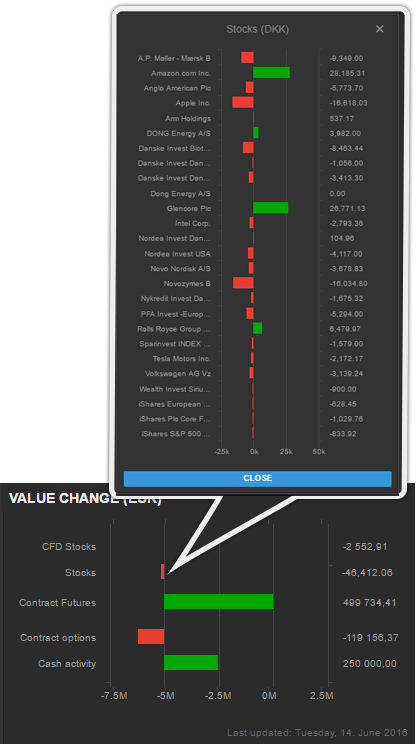
The Performance report in the Account Overview now contains new Exposure and Value Change bar charts, which provide a breakdown of exposure and value change in each asset class for the selected period, and make it possible to drill-down into the exposure and change in underlying securities.

For the account, or all accounts, selected in the account drop-down, the exposure bar chart shows exposure per asset class at the end of the selected period.

Short positions are shown as red negative values and long positions will be seen as green positive values.

Margin Products

For margin products like CFDs, Futures and FX, the exposure is equal to the value of the underlying positions.

Cash Positions

For cash products like Stocks and Bonds, the exposure is equal to the market value of the position.

Options Premiums

For Options, the exposure is equal to the premium which can be both positive if long and negative if short.

All values are converted into the currency of the selected account.

Exposure to underlying securities

The Exposure Chart also makes it possible to drill-down into the underlying securities by clicking on the bar for each asset class, which shows holdings at the end of the last trading day in the selected period.

Value Change Chart

The Value Change chart shows the contribution to the account value for each asset class for the selected period and gives an overview of the same data shown in the period report.

Positive contributions are shown in green and negative contributions in red.

All values are converted into the currency of the selected account.

Cash activity

Cash activity is also itemised with its own bar and shows the net cash activity in the selected period. This can include cash transfers, interest and subscription fees.

Underlying Security Contributions

The Value Change chart also makes it possible to drill-down into the contributions from underlying securities by clicking on the bar for each asset class.

This shows the contribution for each security for the selected period and NOT over the full lifetime of the position.

May 2016 New Products & Platform Updates

Table of Contents


Simplified FX Stop Orders

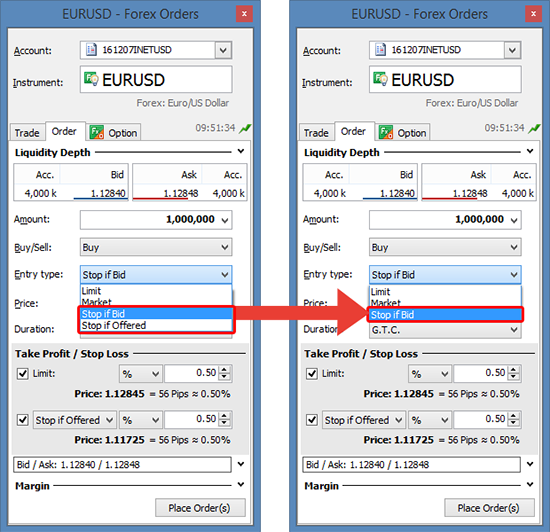
FX Stop orders have been simplified in the GTS Pro, where ‘Stop if Bid’ sell and ‘Stop if Offered’ buy orders will be removed and replaced with a single ‘Stop’ order that will automatically trigger on the appropriate side.

Existing Stop if Bid and Stop if Offered orders will not be immediately affected, but on Saturday June 11th they will be converted to the new stop order convention:

  • Stop if Bid sell orders will be converted to Stop if Offer
  • Stop if Offer buy orders will be converted to Stop If Bid

Note that the client order level will stay the same.

Triggering Stop Orders

Stop orders will be triggered using institutional practices where:

  • Buy orders will be triggered on the Bid price
  • Sell orders will be triggered on the Offer price

To some clients this may seem counter-intuitive, but it has long been the convention in institutional trading as it eliminates spread effects from strategies where trades can be prematurely triggered from a sudden widening of the Bid/Ask spread during volatile market conditions.

This convention is already used in the GTS platform.

Stop Order Fills

When Stop orders are triggered, they become market orders and filled at the best available price in the market at the time:

  • Buy orders will be filled on the Offer price
  • Sell orders will be filled on the Bid price

It is important to understand that triggering an order on the opposite side of the spread is not slippage; it is a way for clients to trade at a price only when there are other legitimate buyers or sellers active in the market as a way to avoid triggering due to temporary spread widening. Spot orders always become market orders when triggered and are filled at the market price, however market spreads are not something in a broker’s control.

New Market Overview in GTS

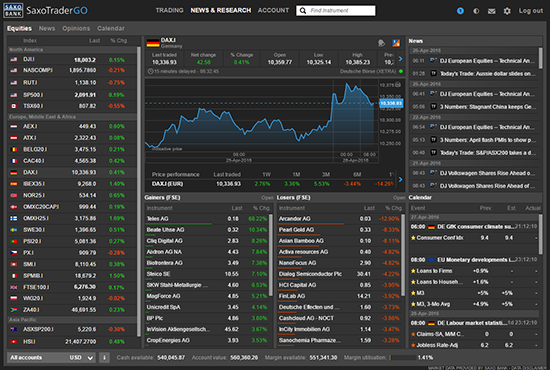
The News & Research section of GTS will now include a comprehensive overview of global equity markets including:

  • Indices
  • Gainers and Losers
  • News
  • Calendar Events
  • Overview Chart

Indices Overview

Indices display the last traded value and intraday percentage.
Selecting an index from the list selects the overview chart, gainers and losers, news and calendar events from the exchange mapped to the index.

Gainers / Losers

The Gainers / Losers displays the 20 highest and 20 lowest performing stocks from the exchange mapped to that index. Note that Gainers / Losers is based on the entire exchange mapped to the index, not just the index constituents.

Context Menu

Click on an instrument in the Gainers or Losers to access a context menu to trade, open Equity Research (if subscribed), add a price alert or open the Overview for the instrument.

Overview Chart

The Overview chart offers a 24-hour (fixed) view of index, additional price information and performance data for 1W, 1M, 3M, 6M, 1Y, 2Y, 5Y.

Where available, the selected index can be traded by clicking on the product icon to open a trade ticket.

Price alerts can also be added for a select instrument.

News

News displays filtered news for the selected index based on the news subscriptions available.

Calendar Events

Calendar events displays upcoming events related to the selected index for the next five calendar days. Each event has a countdown associated with the expected release of actuals being published. Once countdown is reached, the counter will disappear as actuals are published.

Other New Features in GTS

Other new features in GTS include:

Sorting on columns

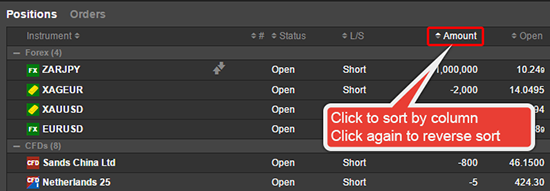
You can now sort by most columns on the Watchlist, Positions List and Orders List by clicking on the column header. This will order (or reverse order) the table based on the column content but maintain product groups.

Account filter removed in the Positions and Orders Lists

The Positions List and Orders List are now filtered for the Account selected in the Account Selector in the Account Toolbar:

Additional Time Zones

A number of new time zones are now available in the GTS platform.


Improvements to Order Management

Manage your Orders from the Open Positions list

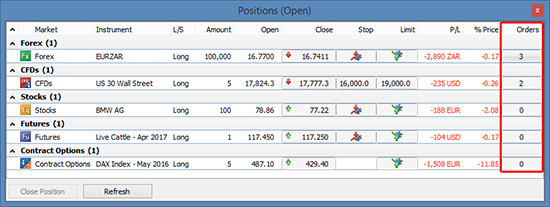
A new column called Orders is now available in the Open Positions list in GTS Pro.

The button shows the number of orders for the instrument on the same account. Click the Order button to open the list of orders where you can edit, cancel or create new orders for the instrument:

The overview shows the:

  • Net position
  • Total Amount of Buy and Sell orders
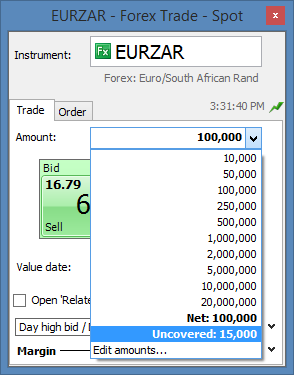
  • Uncovered amount showing the difference between the Net position and the Order amount. For example, if you have a long EURUSD position for 1M and a sell order to close 250,000, the Uncovered would be 750,000

Access from the Watchlist, Chart, Instrument Explorer, Trade Tickets

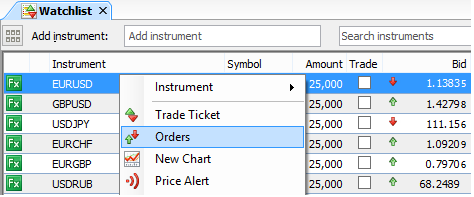
Filtered Orders can also be accessed from the right-click context menu for an instrument from the Watchlist, Chart, Instrument Explorer, Trade Tickets, etc.

Uncovered Amount in the Trade ticket

The Uncovered amount for an instrument – the difference between the Net position and the Order amount – is now available from the Amount selector for the instrument in the Trade Ticket.